NCSS Upgrade Information
- New in NCSS 2024
- New in NCSS 2023
- New in NCSS 2022
- New in NCSS 2021
- New in NCSS 2020
- New in NCSS 2019
- New in NCSS 12
- New in NCSS 11
- New in NCSS 10
- New in NCSS 9
What's New in NCSS 2024?
Upgrade at the Online StoreWe are pleased to announce the release of NCSS 2024, the latest edition of our statistical analysis and graphics software. We are confident you will find the enhancements and re-worked procedures highly suitable for your research needs.
New (Modified) Procedures in NCSS 2024
Curve Fitting
All the curve fitting procedures in NCSS were re-worked for clarity, ease-of-use, and functionality.- General (Custom and Preset) Model Fit - Y vs One X
- Polynomial Model Search - Y vs One X
- Polynomial Model Fit - Y vs One X
- Polynomial Model Search - Y vs Multiple X's
- Polynomial Model Fit - Y vs Multiple X's
- Age-Specific Reference Intervals
- Fractional Polynomial Regression - Y vs One X
- Michaelis-Menten Model Fit - Y vs One X
- Sum of Functions (of X) Model Fit - Y vs One X
- Reference Intervals
Updated Procedures in NCSS 2024
The input and/or the output was updated in the following procedures:- Descriptive Statistics
- One-Sample T-Test
- One-Sample T-Test for Non-Inferiority
- One-Sample T-Test for Superiority by a Margin
- One-Sample T-Test for Equivalence
- Paired T-Test
- Paired T-Test for Non-Inferiority
- Paired T-Test for Superiority by a Margin
- Paired T-Test for Equivalence
- Two-Sample T-Test
- Two-Sample T-Test from Means and SD's
- Two-Sample T-Test for Non-Inferiority
- Two-Sample T-Test for Superiority by a Margin
- Two-Sample T-Test for Equivalence
- Hierarchical Clustering / Dendrograms
- Fuzzy Clustering
- K-Means Clustering
- Medoid Partitioning
- Regression Clustering
- Multivariate Analysis of Variance (MANOVA)
- Loglinear Models
- Data Screening
System Improvements in NCSS 2024
Application Scaling (or Zoom)
Application Scaling (Zoom) was added for the ability to customize the size of text throughout NCSS. The default application scale is 25% larger, with the option to customize the application scale (zoom) between 100% (the size of NCSS 2023 and earlier) and 200%.
Application Data Reset and Restore
Application Data Reset and Restore functionality was added to System Options to make it easier to restore NCSS to its factory default settings and restore saved settings.
Free Trial
Click here to download a free trial of NCSS 2024.Compatibility
NCSS 2024 is fully compatible with Windows 11, 10, 8.1, 8, 7, and Vista SP2, on both 32-bit and 64-bit operating systems. Click here to view the minimum system requirements.Prices
Upgrade from NCSS 2023:
$199 (academic/government)
$229 (commercial)
Upgrade from NCSS 2022:
$279 (academic/government)
$299 (commercial)
Upgrade from NCSS 2021:
$349 (academic/government)
$379 (commercial)
Upgrade from NCSS 2020:
$419 (academic/government)
$449 (commercial)
Upgrade from NCSS 2019:
$459 (academic/government)
$509 (commercial)
Upgrade from NCSS 12:
$499 (academic/government)
$559 (commercial)
Upgrade from NCSS 11:
$529 (academic/government)
$609 (commercial)
Upgrade from NCSS 10:
$559 (academic/government)
$659 (commercial)
Upgrade from NCSS 9*:
$569 (academic/government)
$669 (commercial)
Ordering
To obtain your upgrade, order from our secure online store, email us at sales@ncss.com, call us at 1-800-898-6109 (US only) or (801) 546-0445, or fax us at (801) 546-3907.Documentation
PDF versions of the documentation are available directly from each procedure window. These may be displayed or printed. The documentation is also available online by clicking here.Procedures added in the NCSS 2023 Upgrade from NCSS 2022
Curve Fitting - CDF
This procedure estimates the parameters of several probability distributions using paired data that consist of an X variable’s value and its corresponding cumulative distribution function (CDF) value.Meta-Analysis
Three new meta-analysis procedures were added in NCSS 2023. The two-proportions and two-means procedures replace older meta-analysis procedures and incorporate more recent developments and techniques in meta-analysis.- Meta-Analysis of Two Proportions
- Meta-Analysis of Two Means
- Meta-Analysis of Standardized Mean Differences
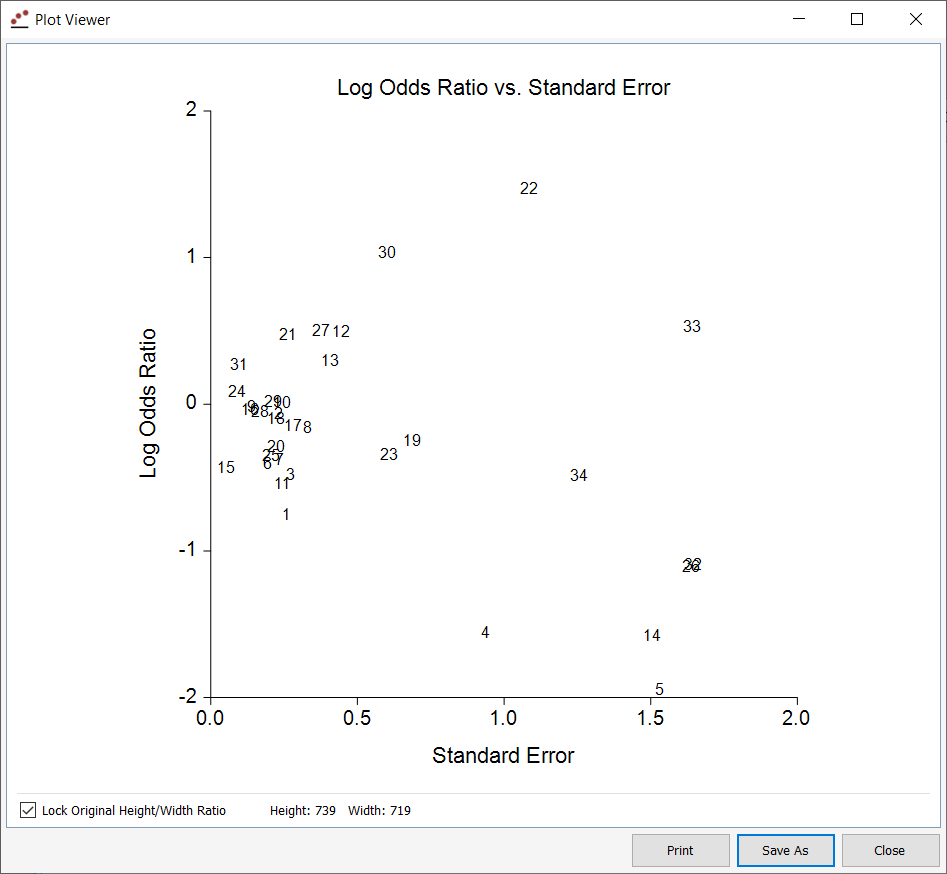
Funnel Plots
Funnel plots were added to the new meta-analysis procedures.
Funnel Plot Example
Linear Regression and Correlation
The Linear Regression and Correlation procedure has been completely re-developed to improve the useability of the input and the output.
Updated Procedures in NCSS 2023
The input and/or the output was updated in the following procedures:
- Multiple Regression
- Multiple Regression - Basic
- Multiple Regression for Appraisal
- Subset Selection in Multiple Regression
- Robust Regression
- Multiple Regression with Serial Correlation
- Cox Regression
- Two-Sample Non-Inferiority Tests for Survival Data using Cox Regression
- Two-Sample Superiority by a Margin Tests for Survival Data using Cox Regression
- Two-Sample Equivalence Tests for Survival Data using Cox Regression
- Logistic Regression
- Poisson Regression
- Negative Binomial Regression
- Geometric Regression
- Zero-Inflated Negative Binomial Regression
- Zero-Inflated Poisson Regression
- One-Way Analysis of Variance
- Balanced Design Analysis of Variance
- General Linear Models (GLM)
- Repeated Measures Analysis of Variance
Enhancements
Documentation
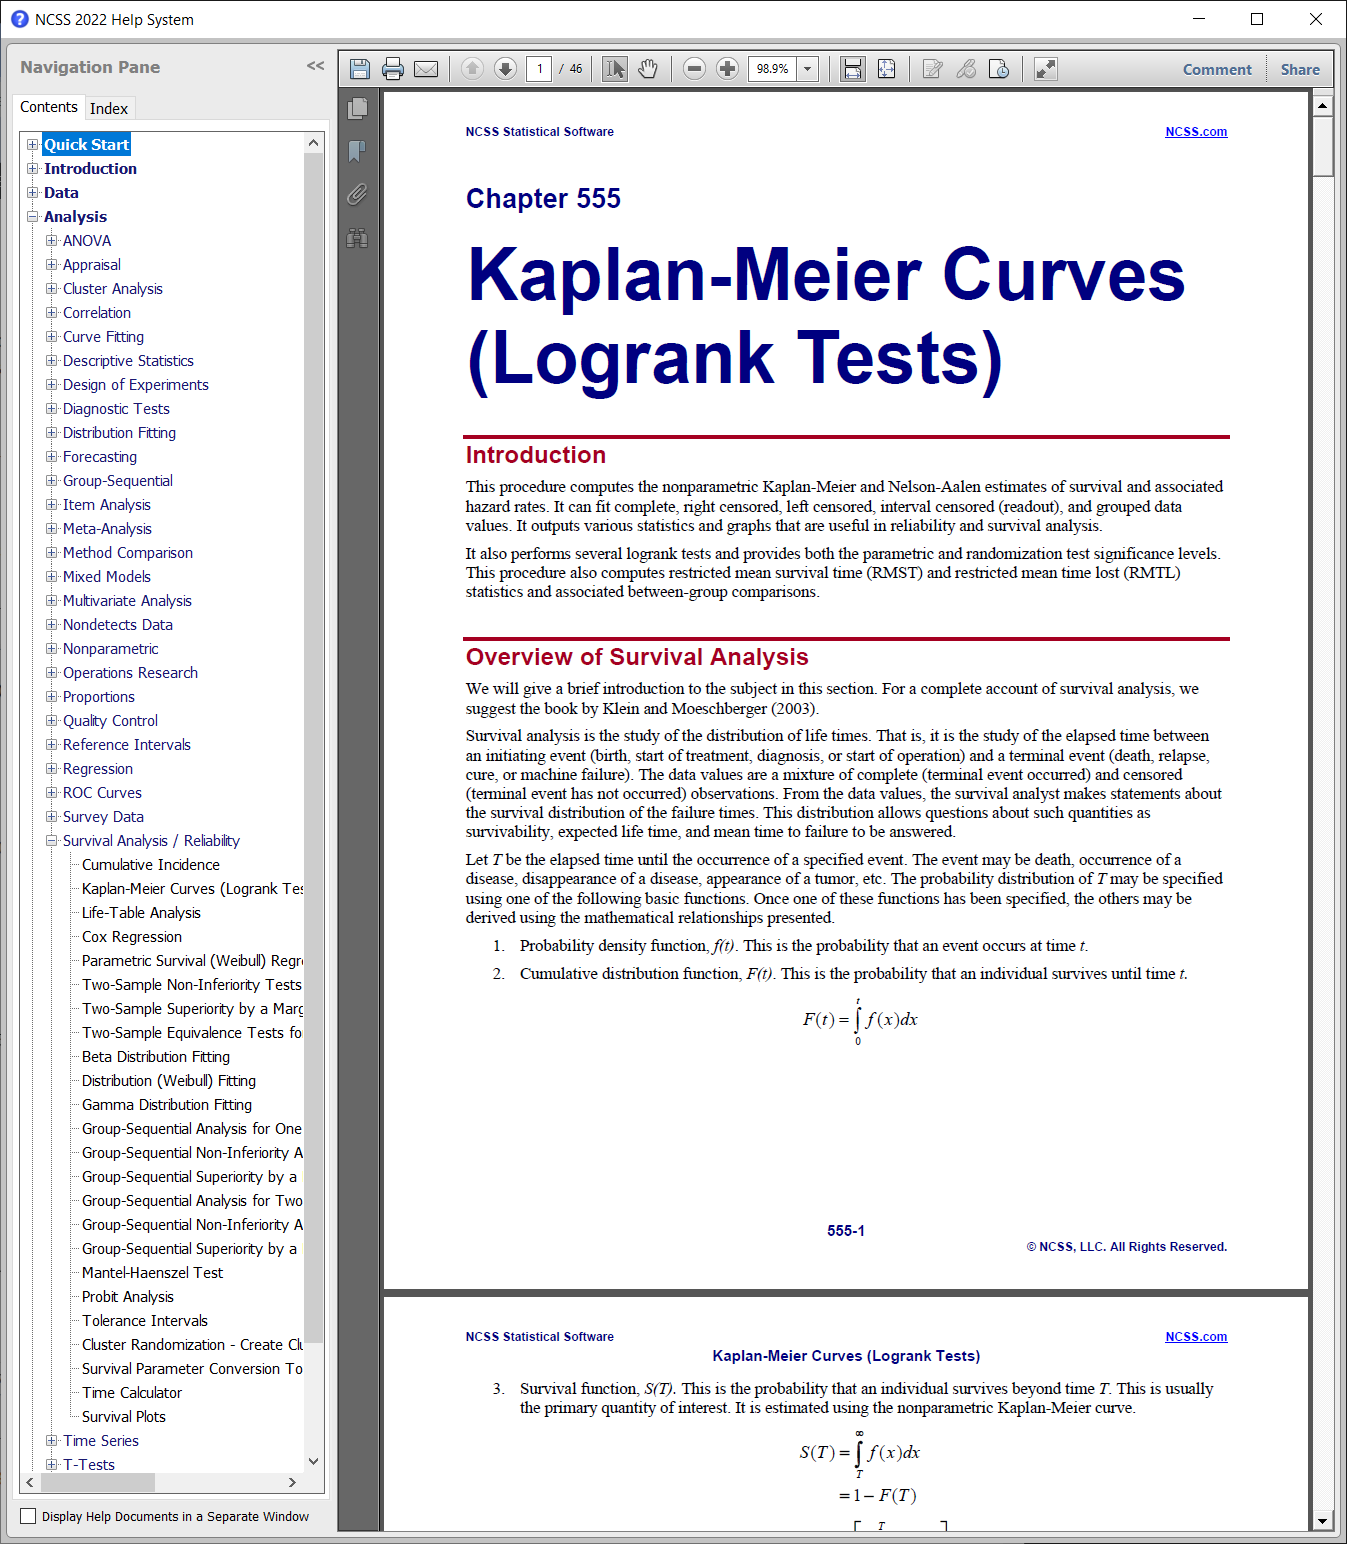
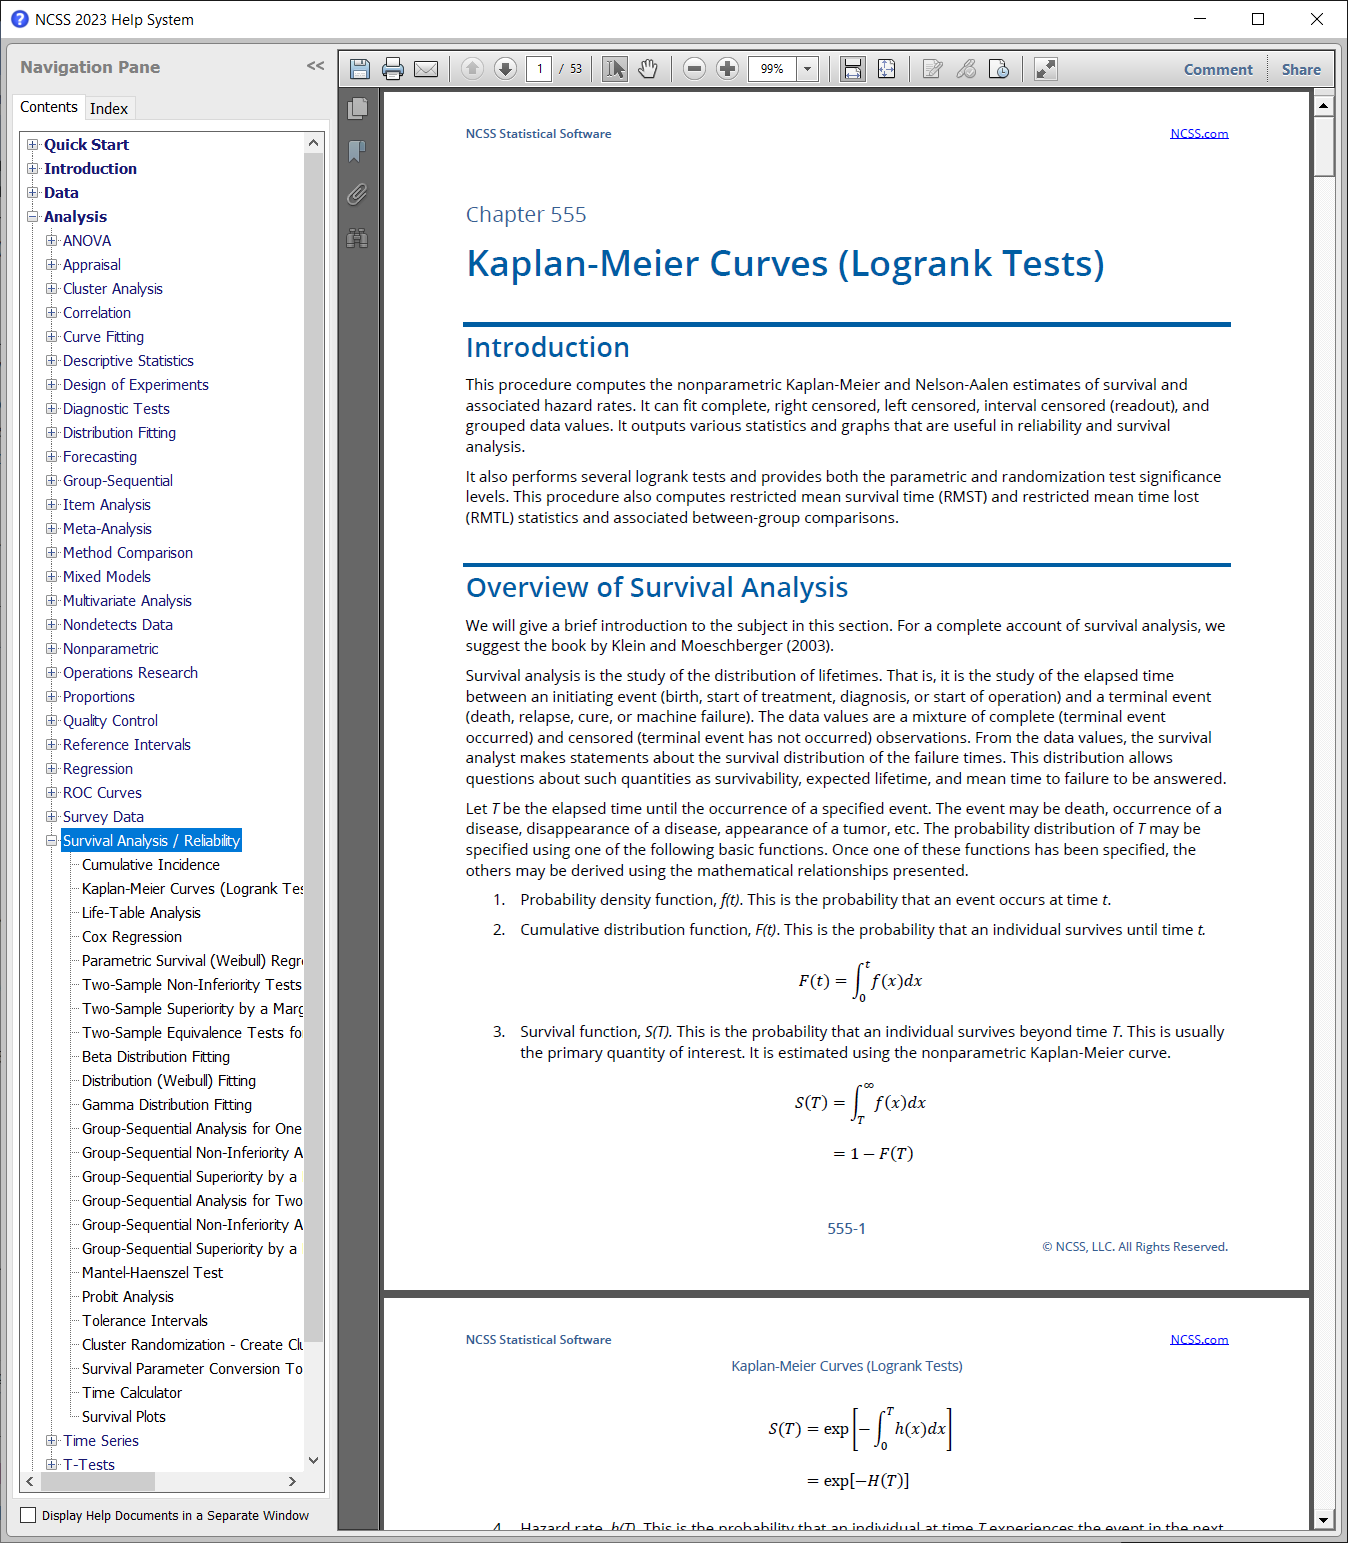
All documentation was updated to provide improved readability and consistency.
Old Documentation Appearance
New Documentation Appearance
Procedures added in the NCSS 2022 Upgrade from NCSS 2021
Exporting Data to R
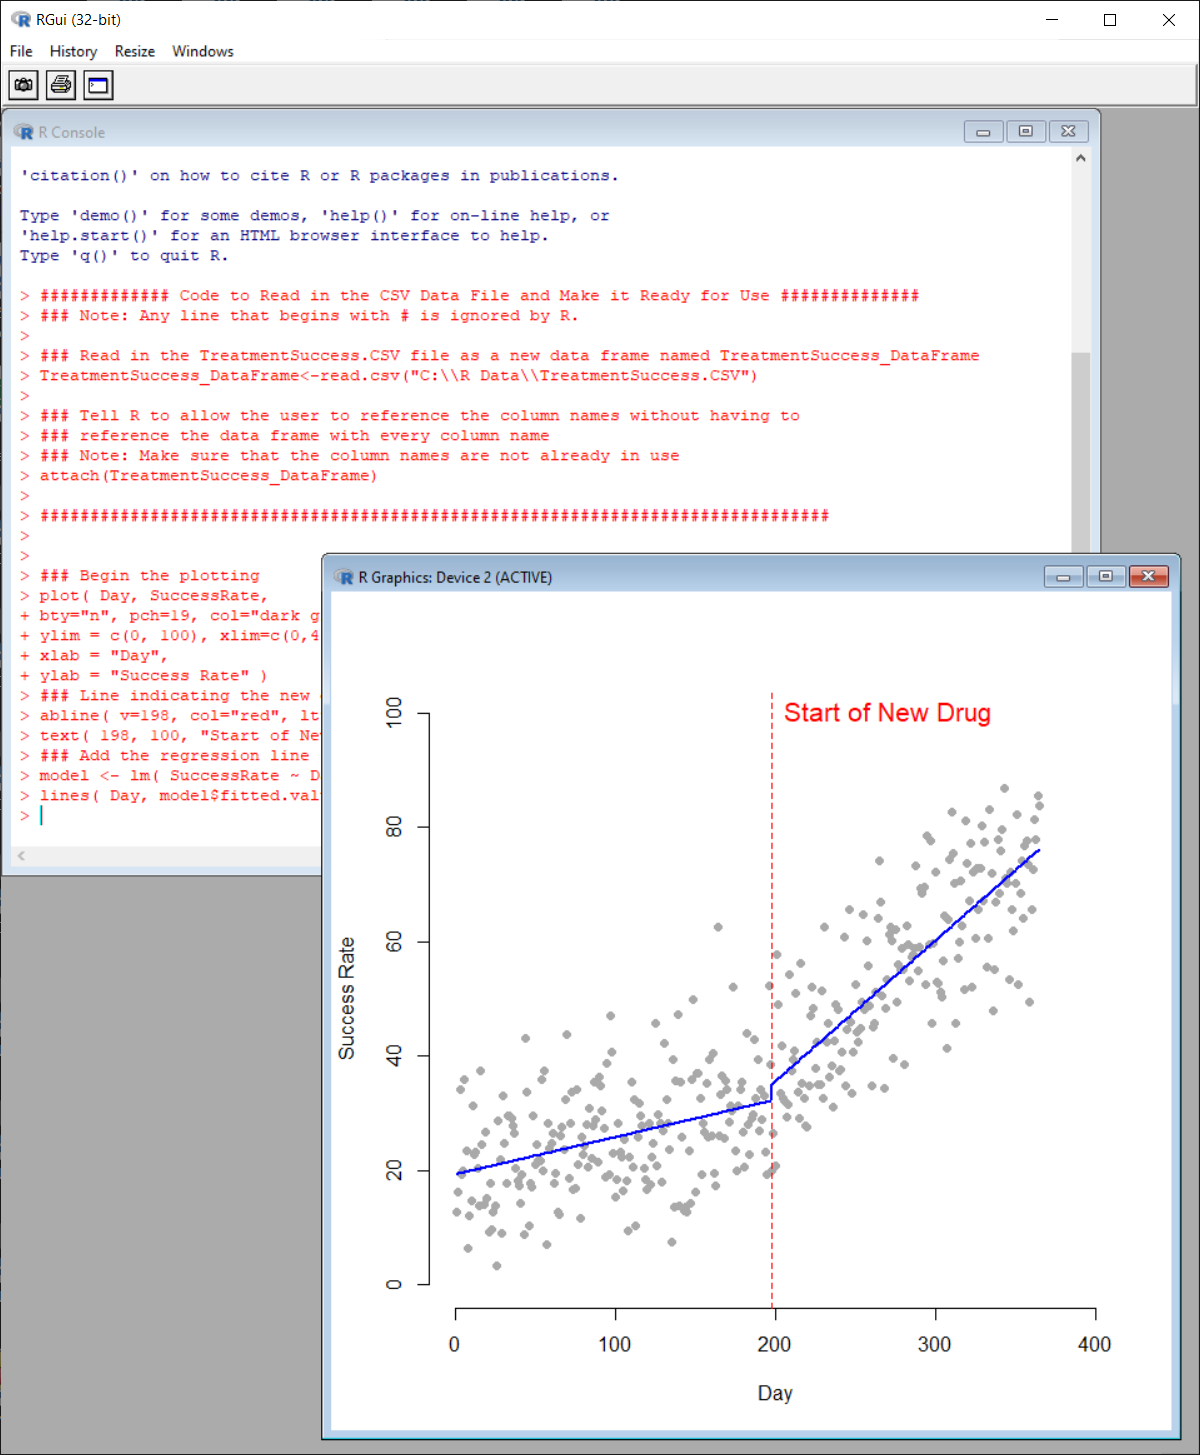
This procedure generates a data file from an NCSS data table that can be read by R, and provides the R code to import the file and ready the columns for immediate use. Once the data is read into R, the user can employ the desired R tools from the various R libraries. In the documentation there are 15 examples of using this procedure.Exporting Data to R Example
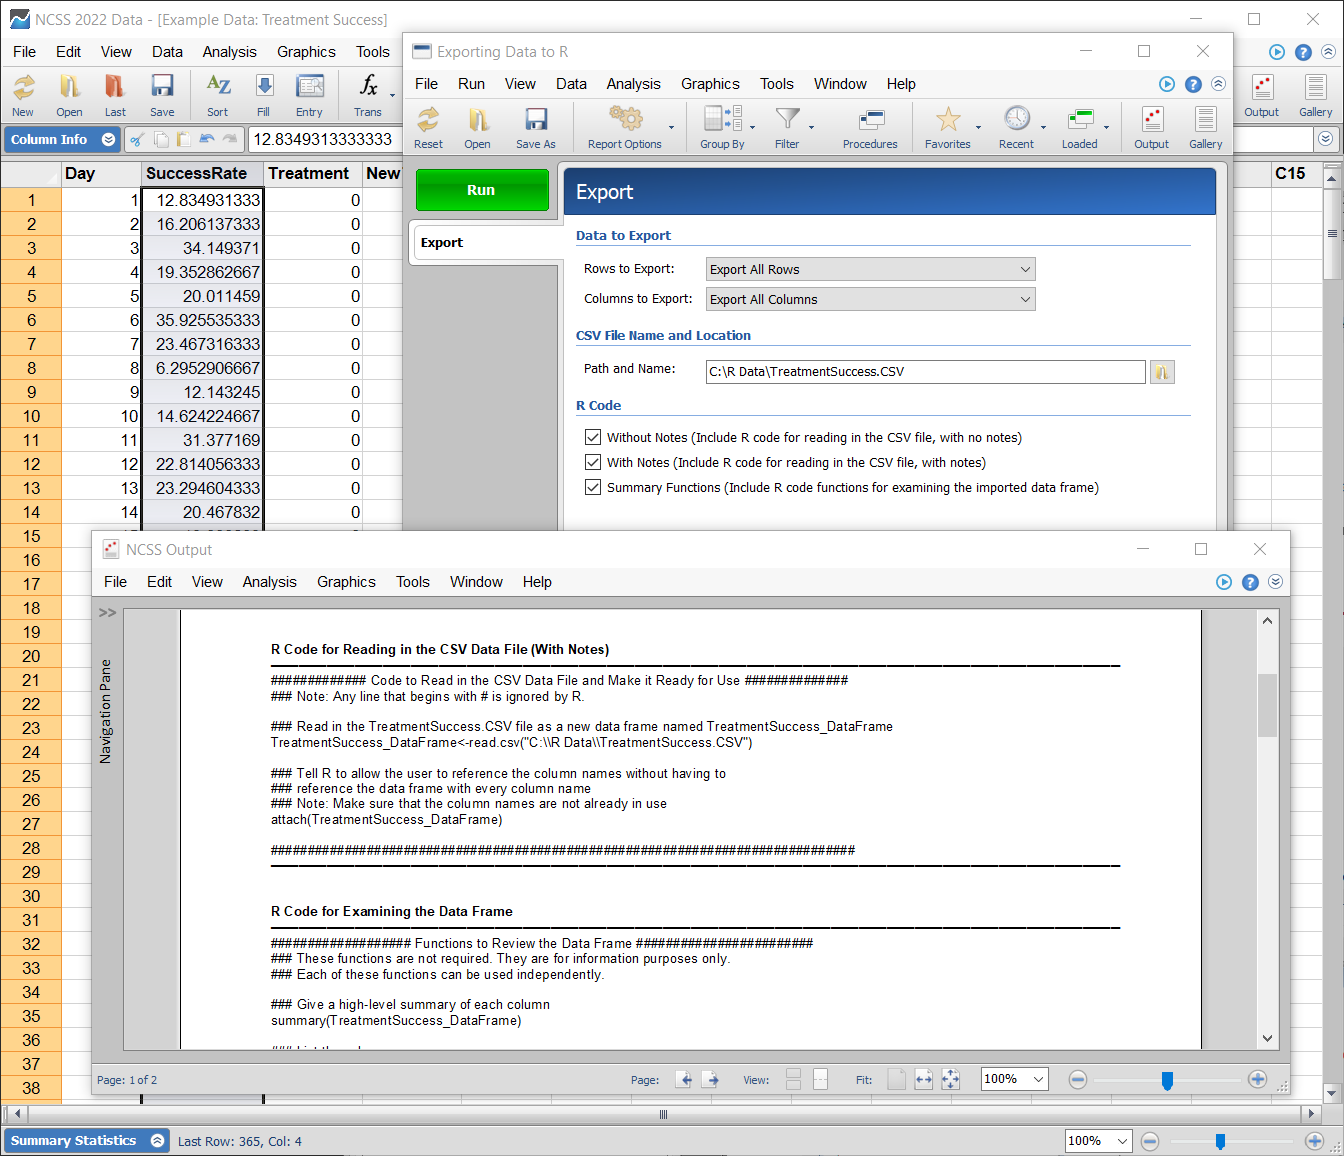
Reading Data into R and Analyzing
Group-Sequential Tests (Efficacy/Futility Boundary Options, Sample Size Re-estimation)
For each of these group-sequential analysis and sample-size re-estimation procedures, there are corresponding group-sequential power and sample size procedures in PASS 2022.- Group-Sequential Analysis for Two Poisson Rates (Simulation)
- Group-Sequential Non-Inferiority Analysis for Two Poisson Rates (Simulation)
- Group-Sequential Superiority by a Margin Analysis for Two Poisson Rates (Simulation)
- -
- Group-Sequential Analysis for One Hazard Rate (Simulation)
- Group-Sequential Non-Inferiority Analysis for One Hazard Rate (Simulation)
- Group-Sequential Superiority by a Margin Analysis for One Hazard Rate (Simulation)
- -
- Group-Sequential Analysis for One Poisson Rate (Simulation)
- Group-Sequential Non-Inferiority Analysis for One Poisson Rate (Simulation)
- Group-Sequential Superiority by a Margin Analysis for One Poisson Rate (Simulation)
Data Entry and Search Tool
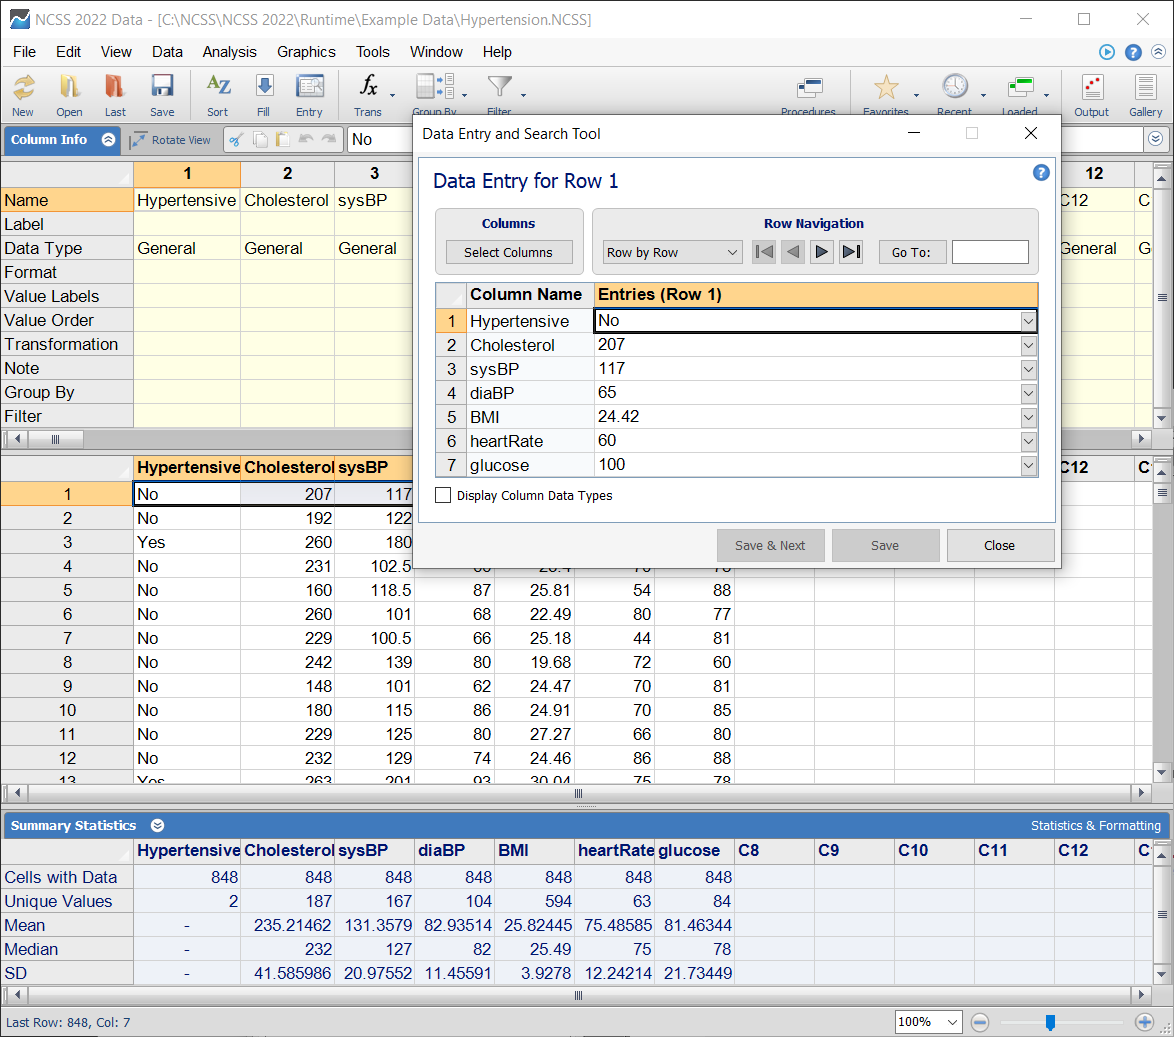
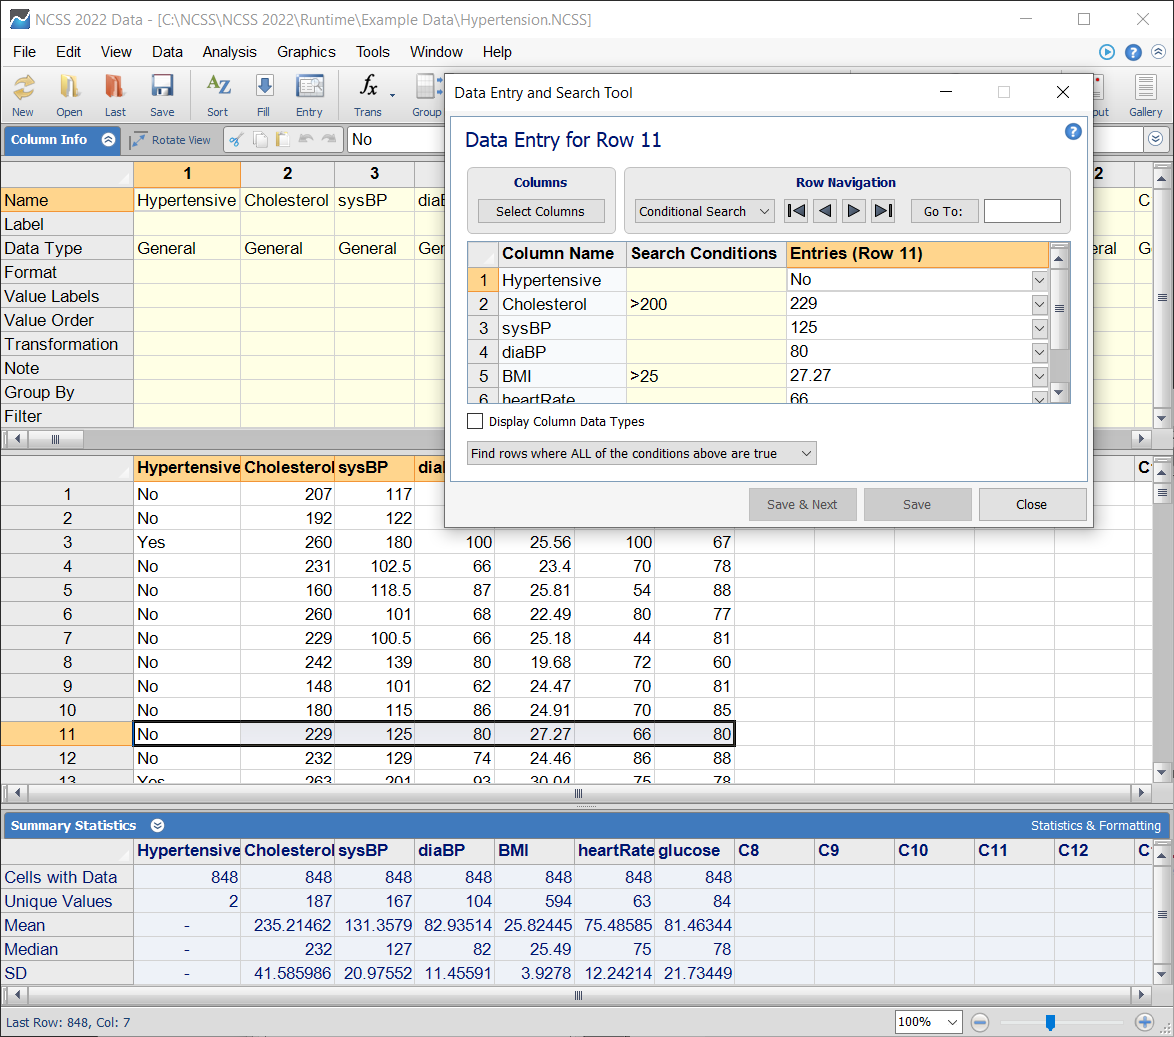
This newly added tool can be used for row-by-row data entry in user-specified columns, and to quickly search for specific rows in the dataset using Search Conditions.Data Entry Example
Data Search Example
Enhancements in NCSS 2022
Windows 11 Compatibility
Testing was performed and the appropriate modifications were completed to make NCSS 2022 compatible with Windows 11.Storage to Columns
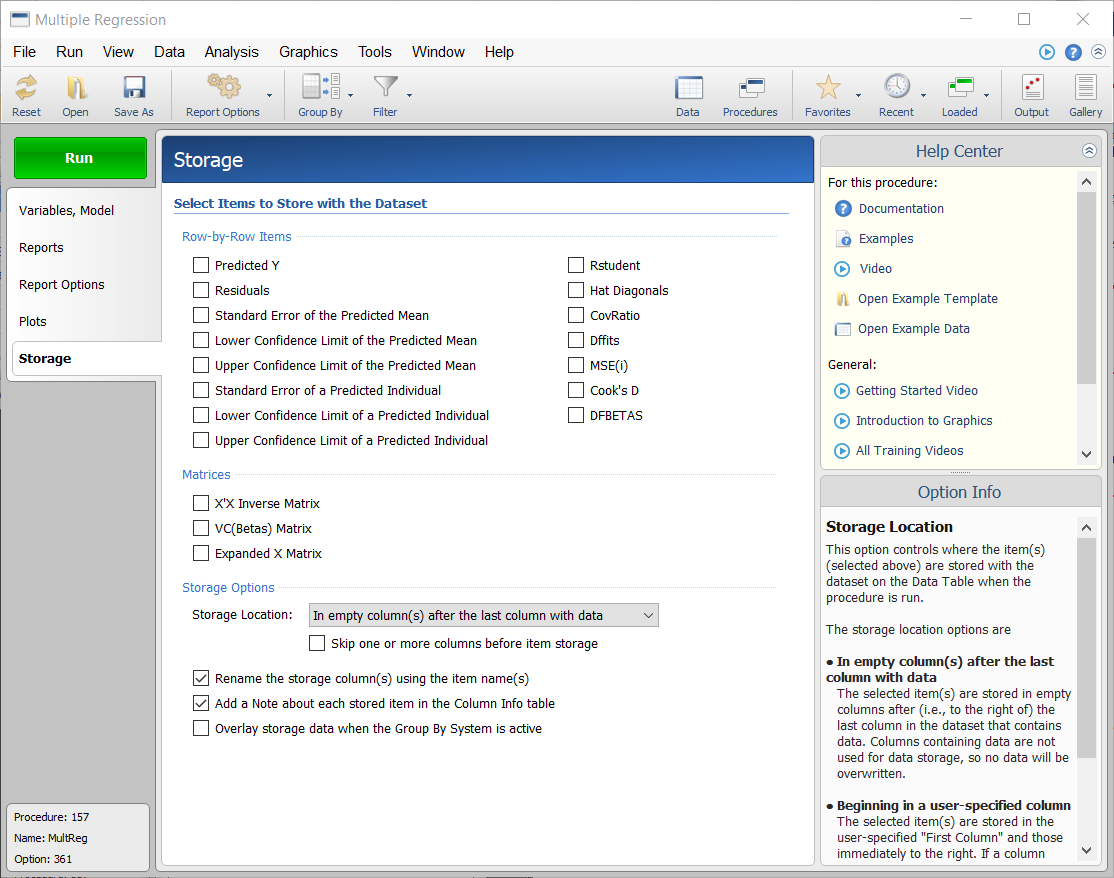
Several improvements were made for all procedures where data can be stored to the data table. Storage columns can be renamed using the item name. A note can be added about each stored item in the Column Info table. The storage system can properly interact with the Group By System.Storage Options Example
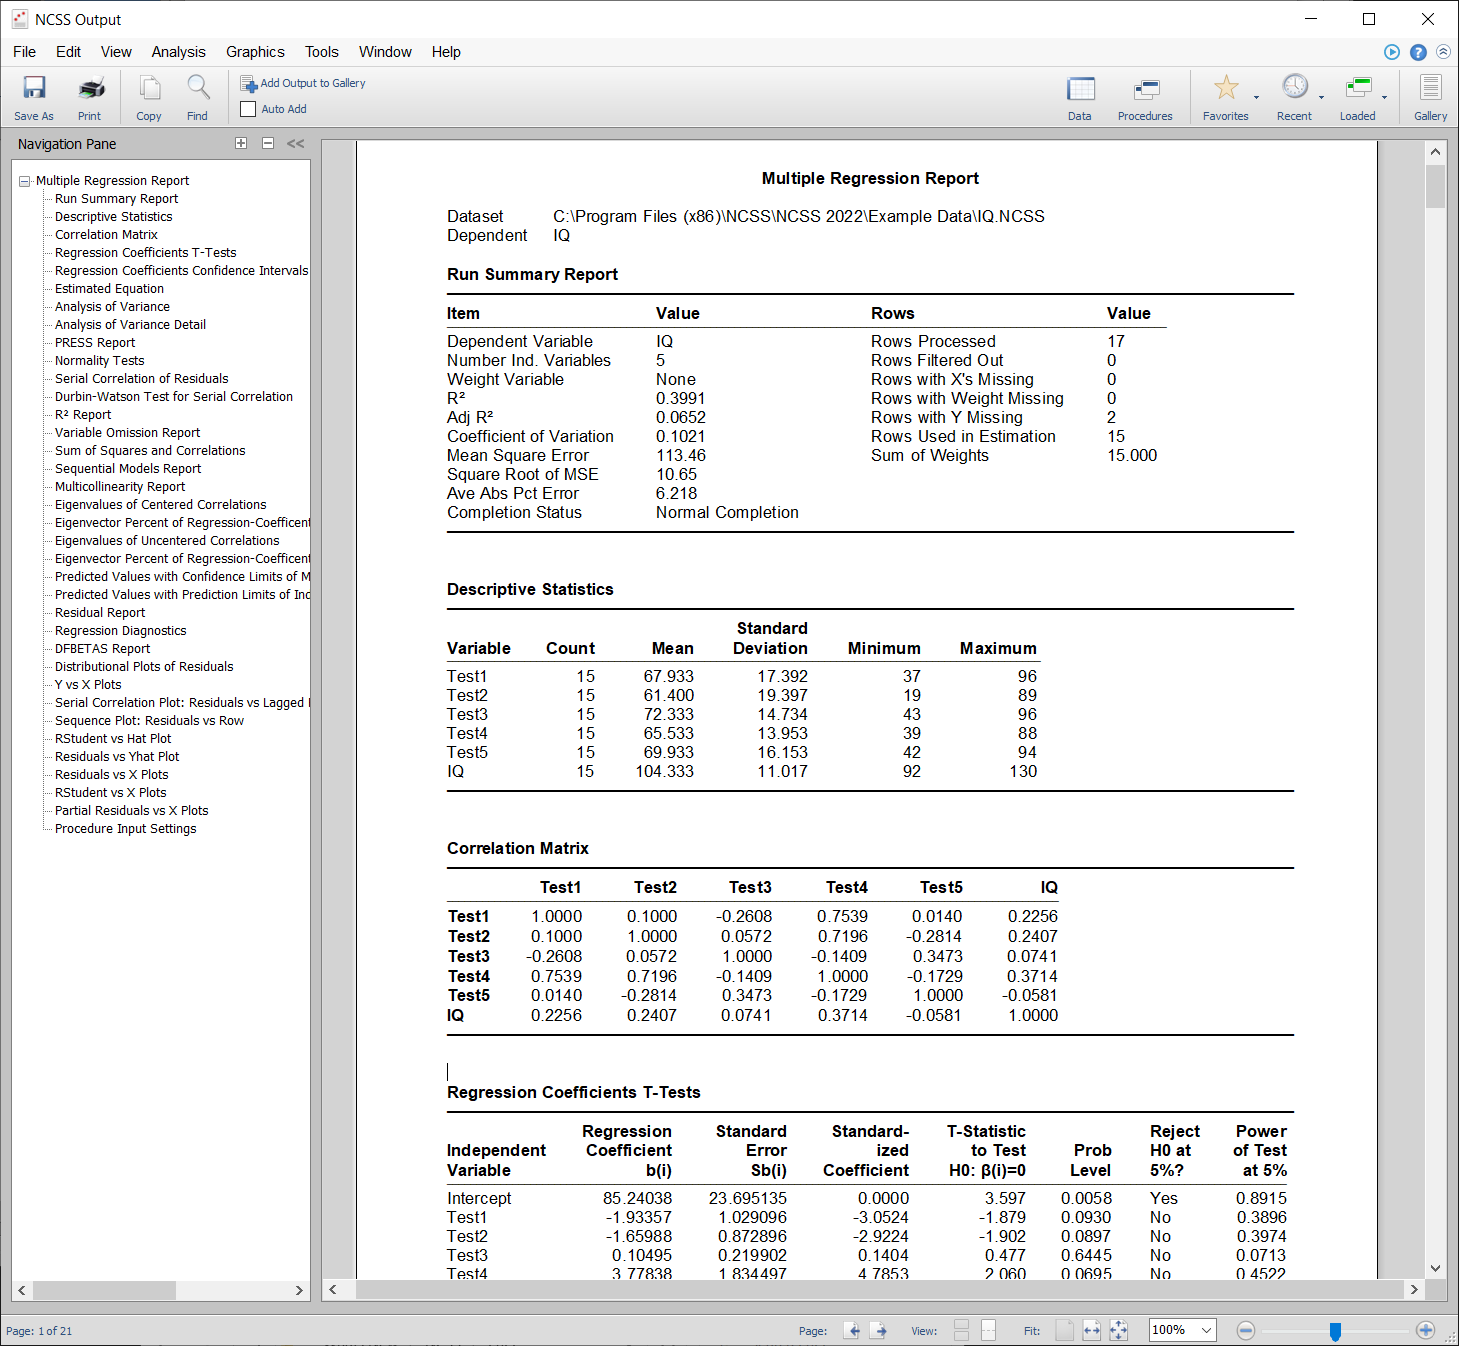
Output Format
The output for all procedures was improved to produce a more readable table format.Old Output Format
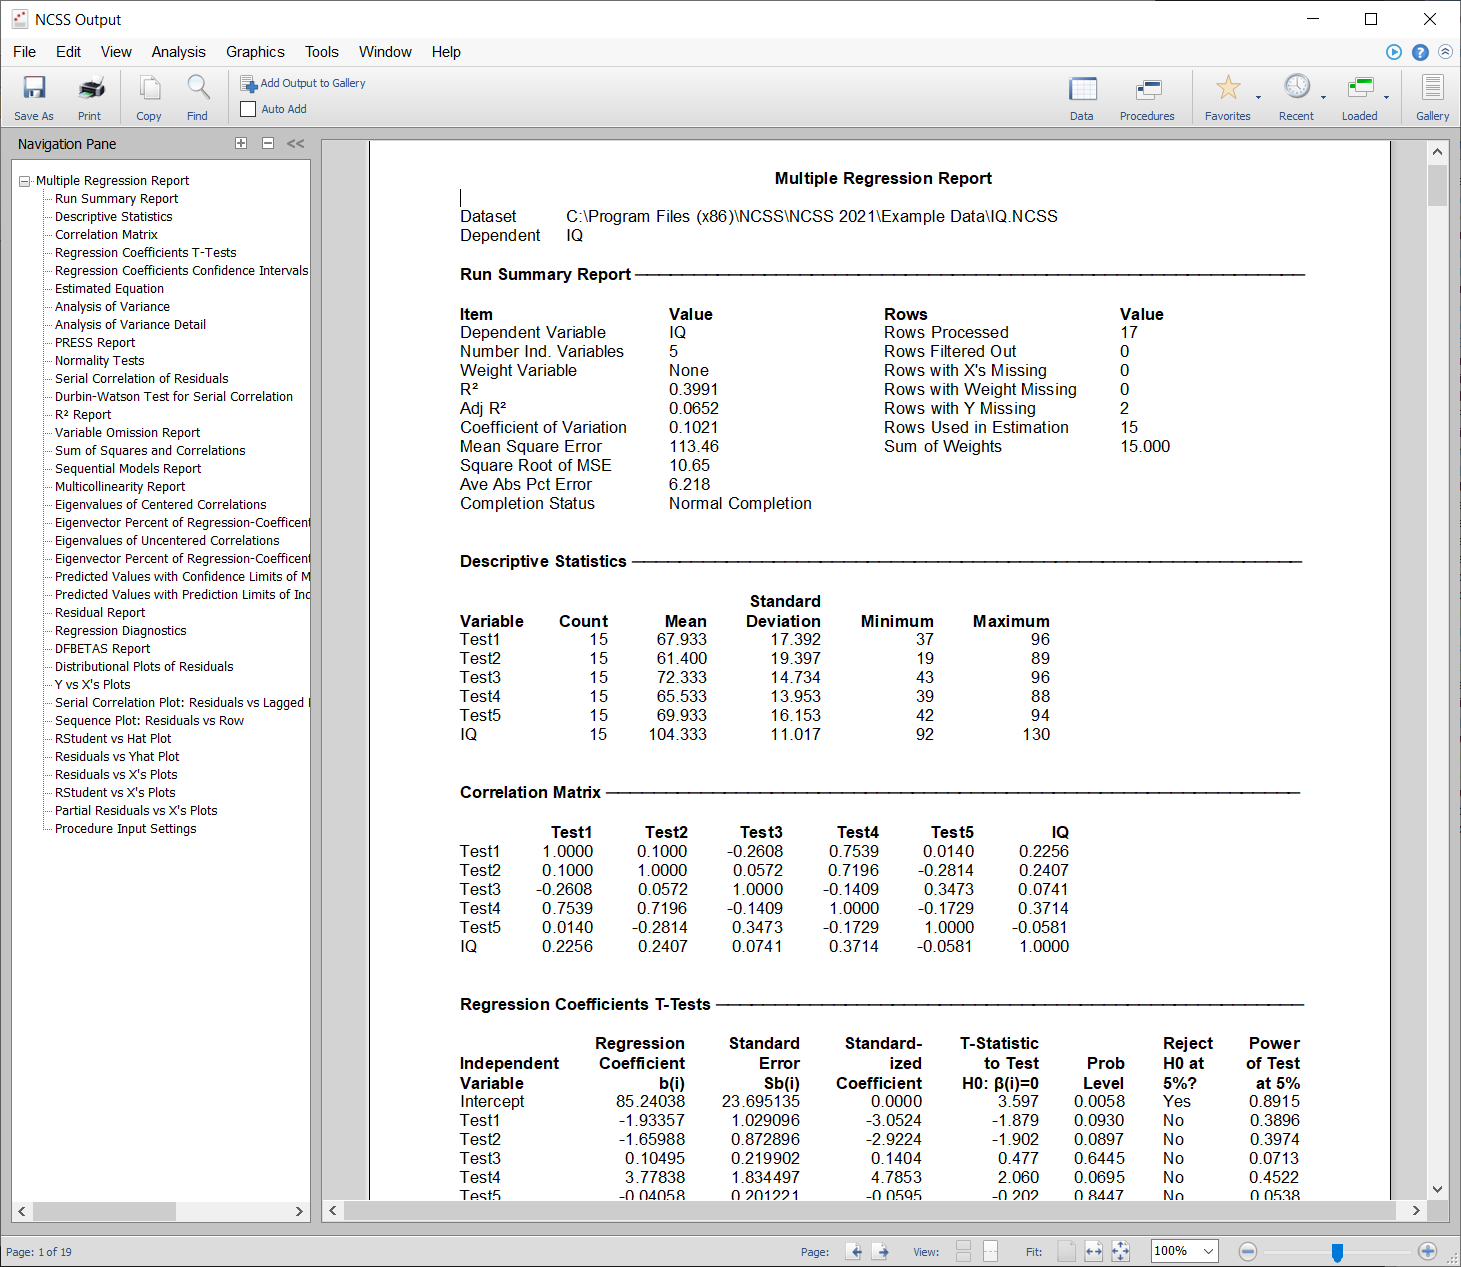
New Output Format
Procedures added in the NCSS 2021 Upgrade from NCSS 2020
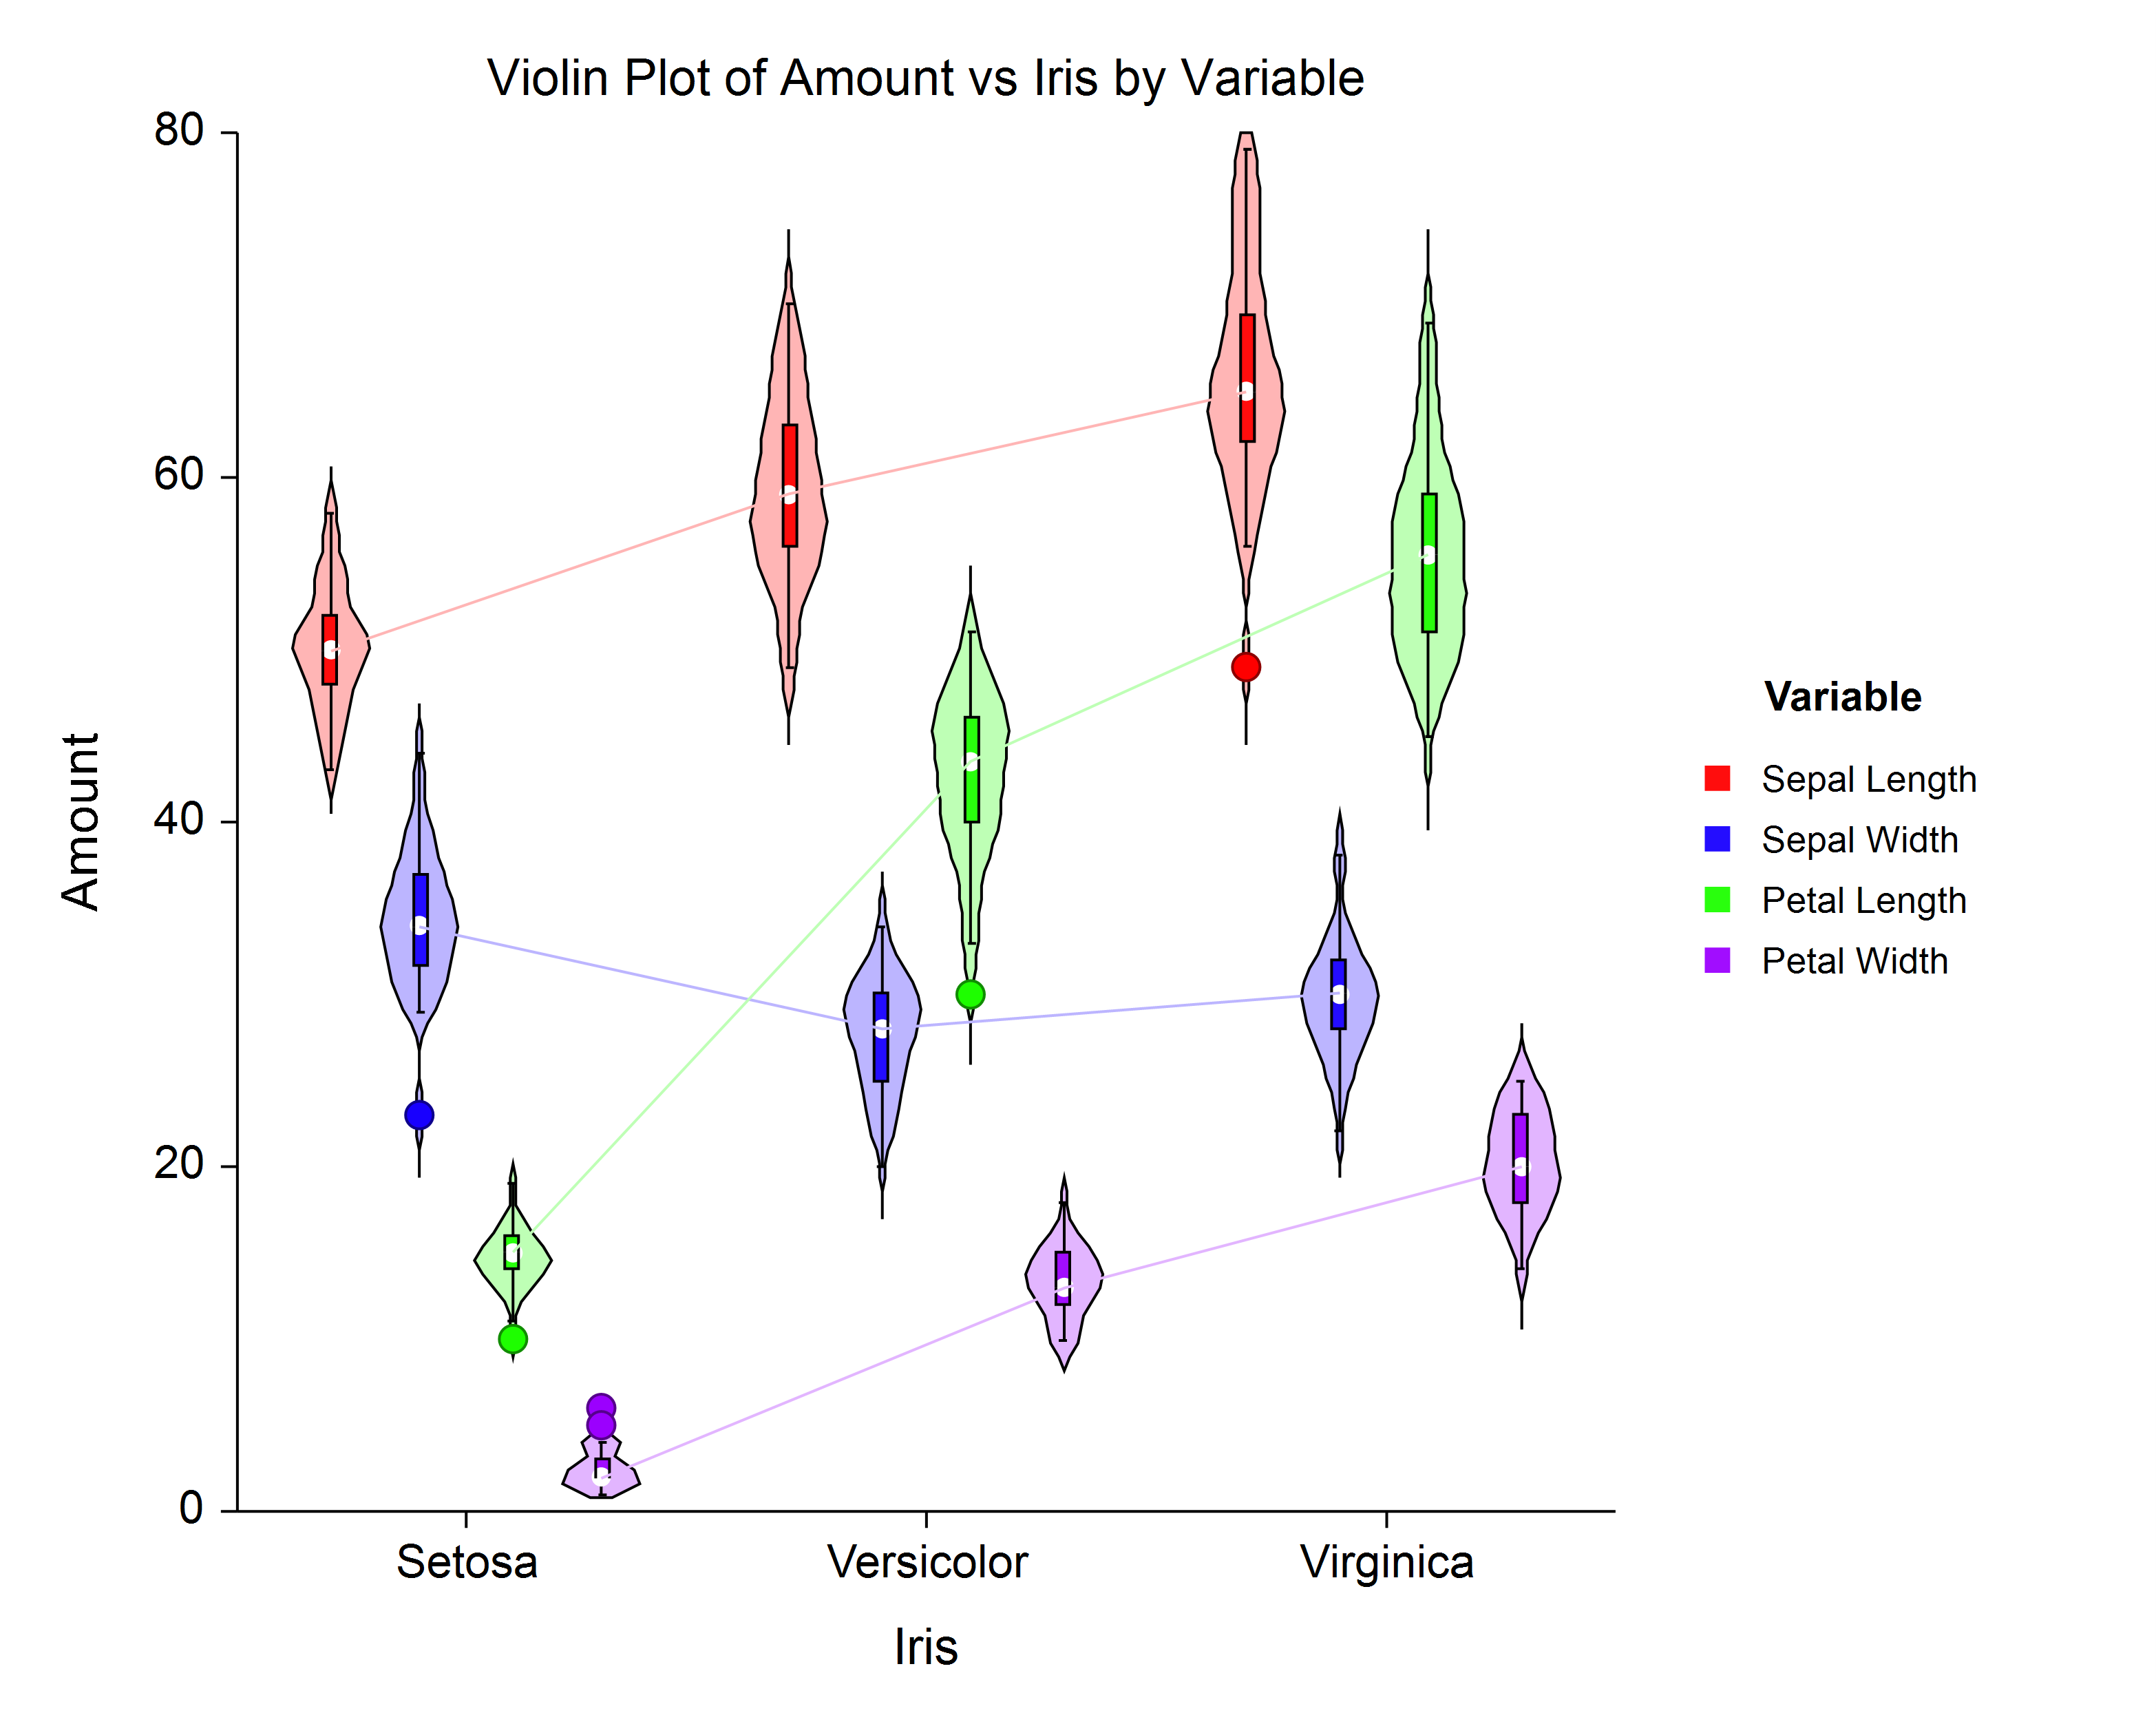
Violin Plots
- Violin Plots
- Violin Plots (2 Factors)
Violin Plot Example
Group-Sequential Tests (Efficacy/Futility Boundary Options, Sample Size Re-estimation)
For each of these group-sequential analysis and sample-size re-estimation procedures, there are corresponding group-sequential power and sample size procedures in PASS 2021.- Group-Sequential Non-Inferiority Analysis for One Mean with Known Variance
- Group-Sequential Superiority by a Margin Analysis for One Mean with Known Variance
- Group-Sequential Non-Inferiority T-Tests for One Mean
- Group-Sequential Superiority by a Margin T-Tests for One Mean
- -
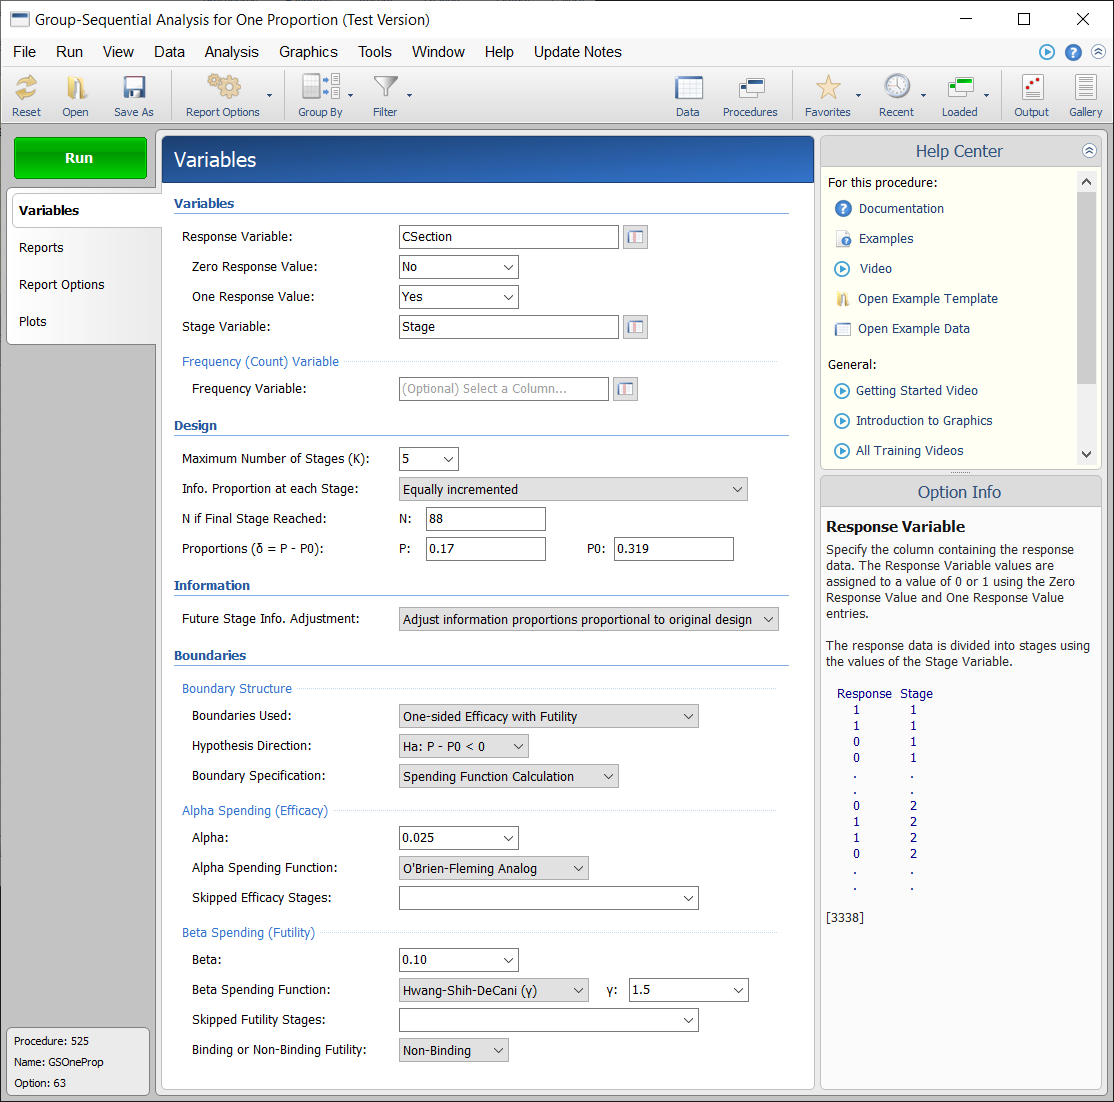
- Group-Sequential Analysis for One Proportion
- Group-Sequential Non-Inferiority Analysis for One Proportion
- Group-Sequential Superiority by a Margin Analysis for One Proportion
Group-Sequential Analysis Input Example
Group-Sequential Analysis Output Example
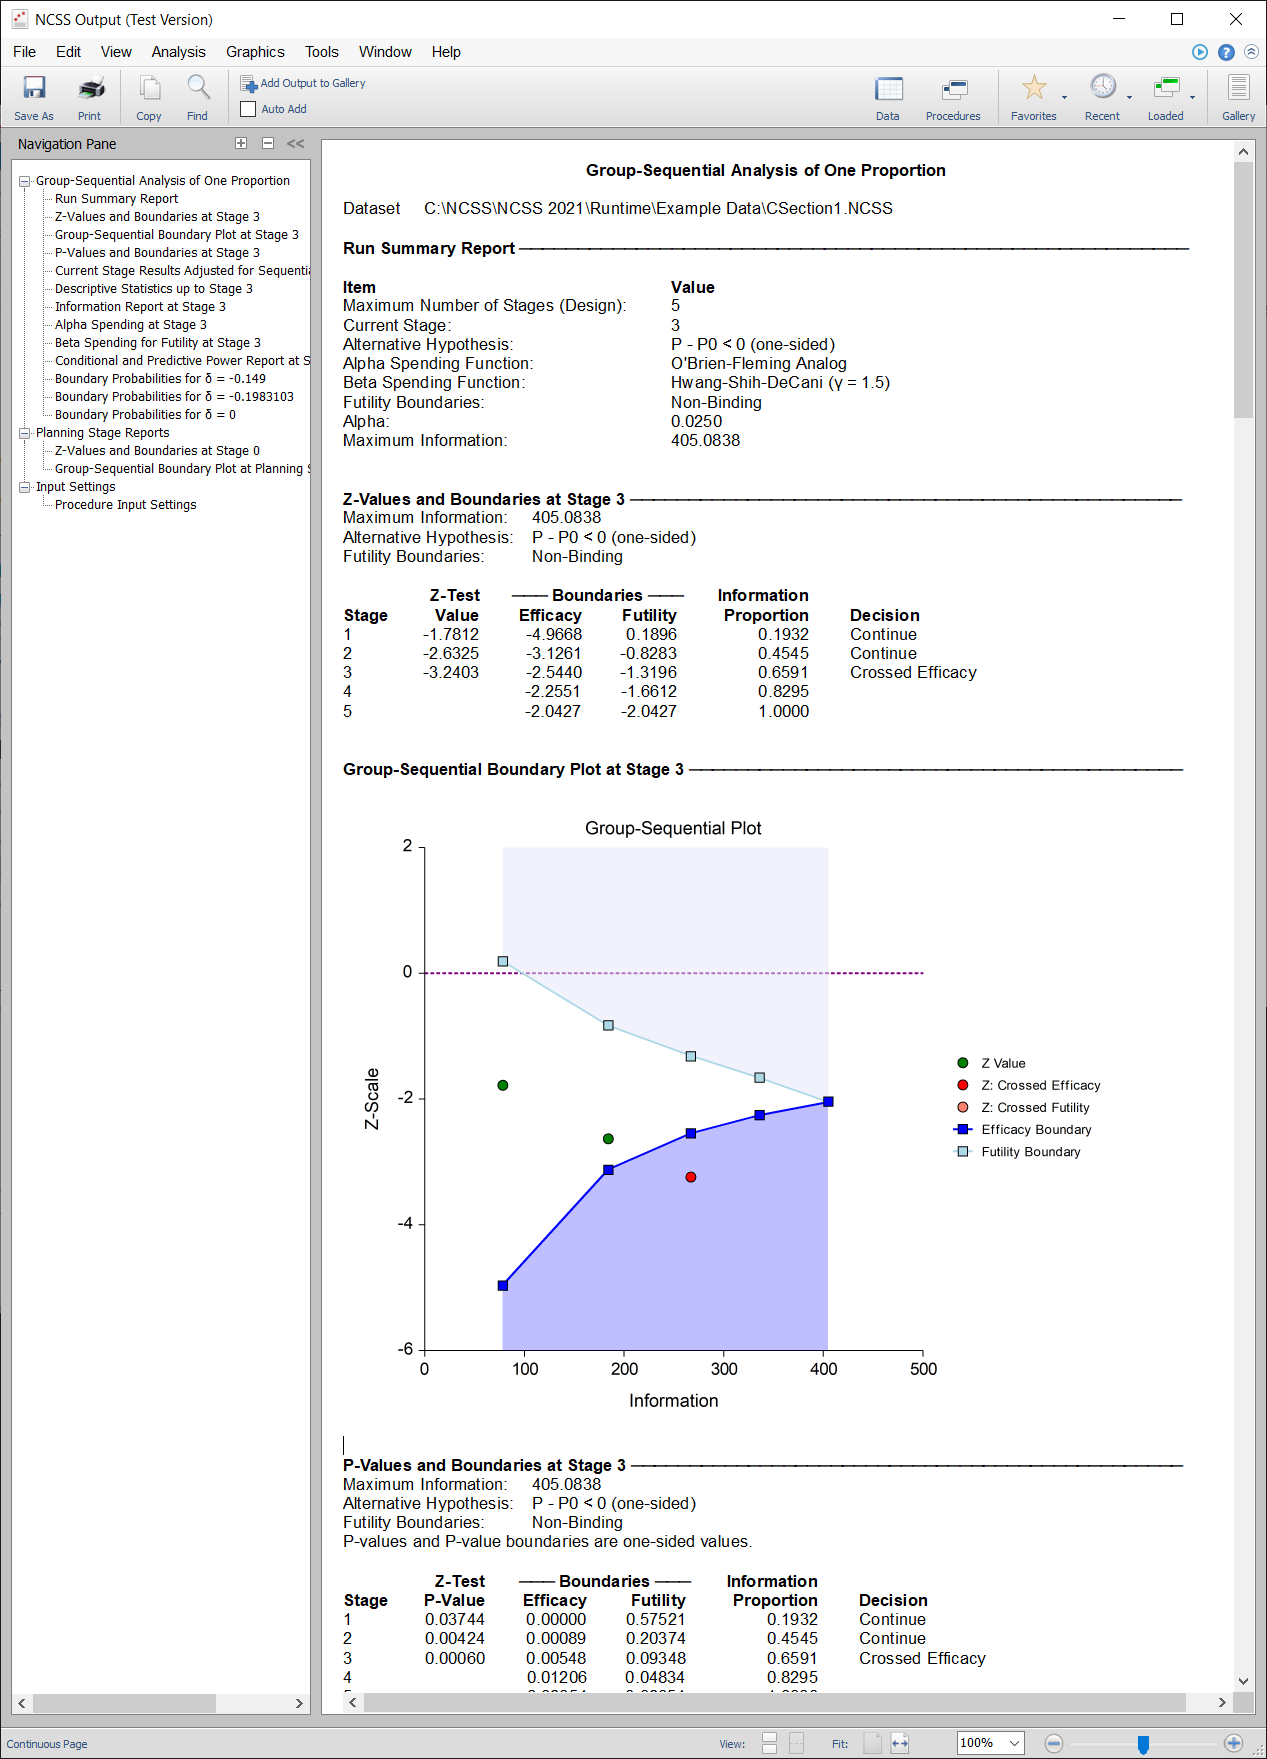
Sample Size Re-Estimation Output Example
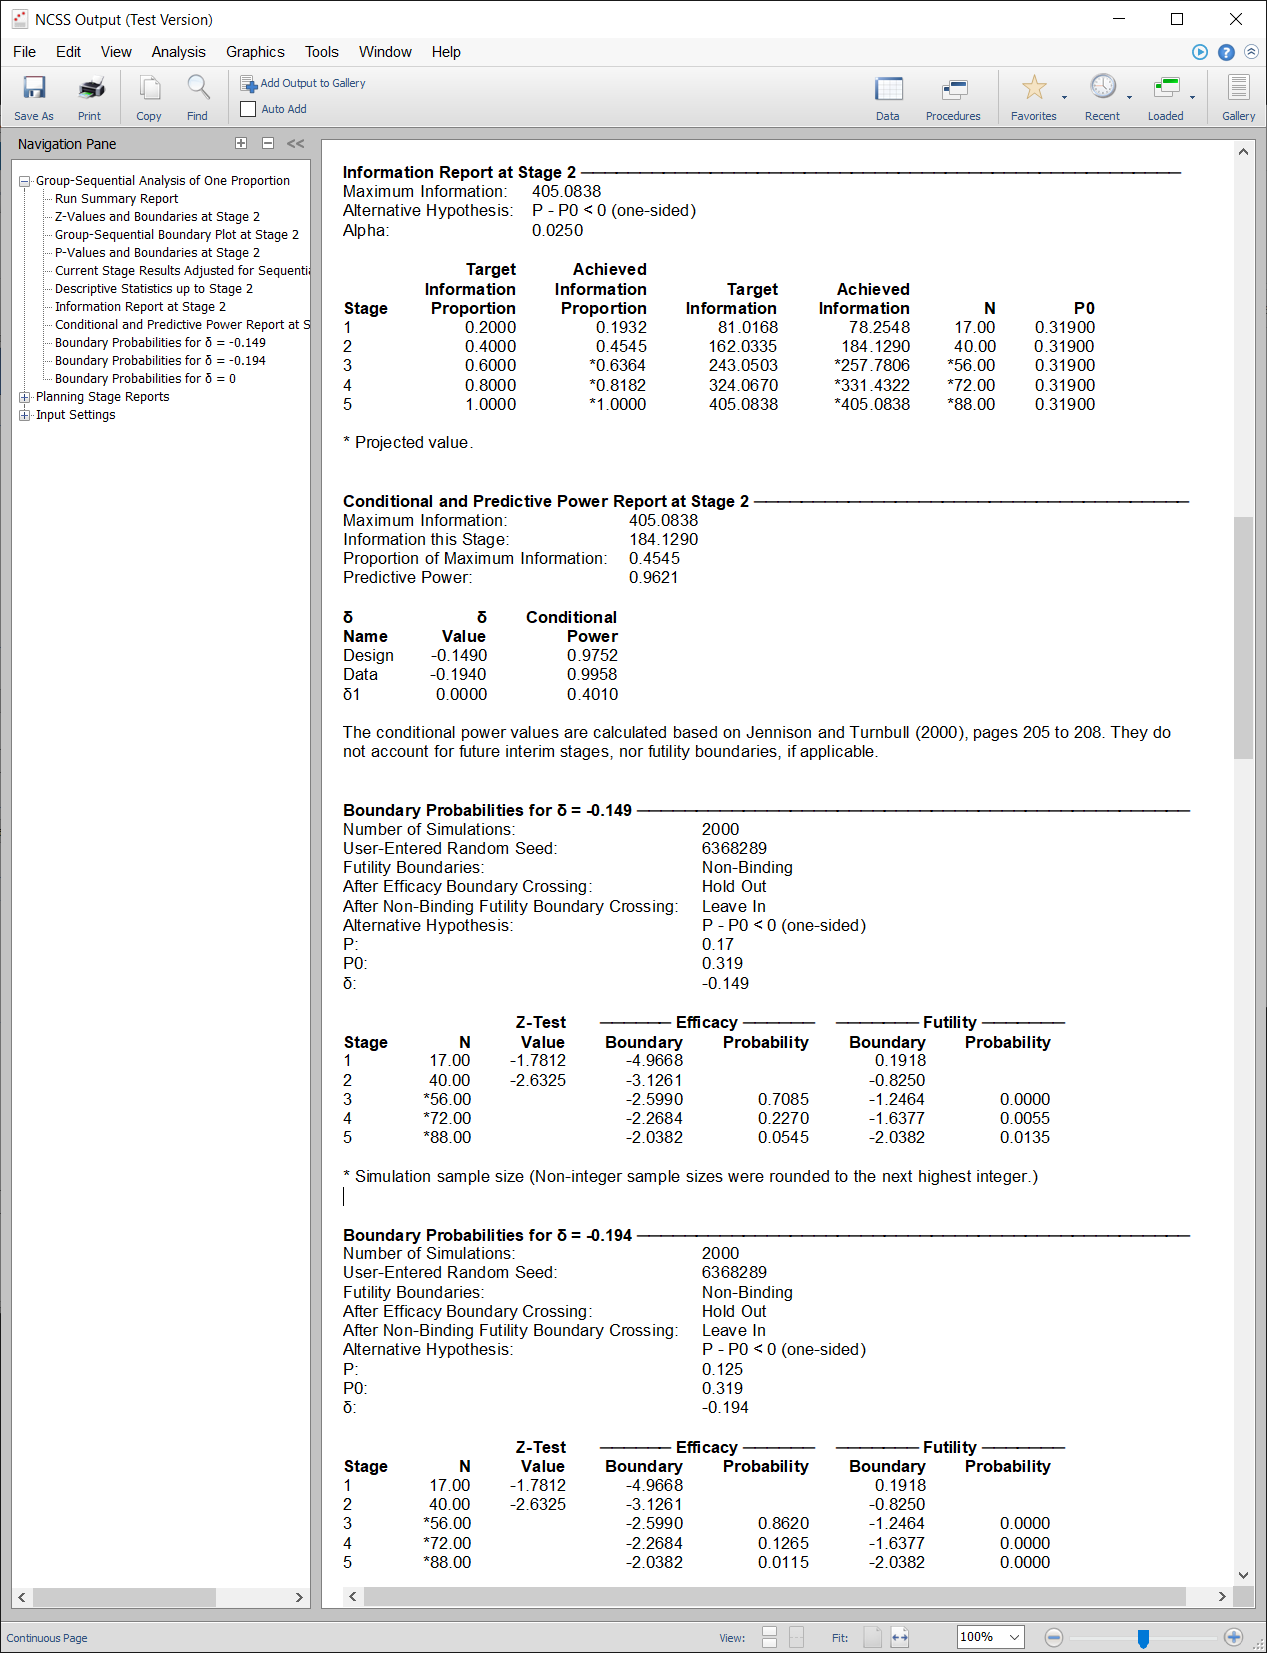
Updated and/or Improved Procedures in NCSS 2021
These procedures have been updated to improve functionality and flexibility.Random Seed
For all procedures that utilize random number generation, a Random Seed option was added, to obtain output reproducibility.Line Charts Added to Several Procedures
For each of these procedures, the option to produce line charts was added.- Frequency Tables
- Contingency Tables
- Descriptive Statistics - Summary Tables
- Descriptive Statistics - Summary Lists
- Cochran's Q
- Two Proportions
- Two Proportions - Non-Inferiority Tests
- Two Proportions - Superiority by a Margin Tests
- Two Proportions - Two-Sided Tests vs. a Margin
- Two Proportions - Equivalence Tests
- Two Correlated Proportions (McNemar Test)
- Two Correlated Proportions - Superiority by a Margin Tests
- Two Correlated Proportions - Equivalence Tests
- Two Correlated Proportions - Non-Inferiority Tests
- Comparables Appraisal
- Cluster Randomization - Create Cluster Means Dataset
- Cluster Randomization - Create Cluster Proportions Dataset
- Cluster Randomization - Create Cluster Rates Dataset
Line Chart Example
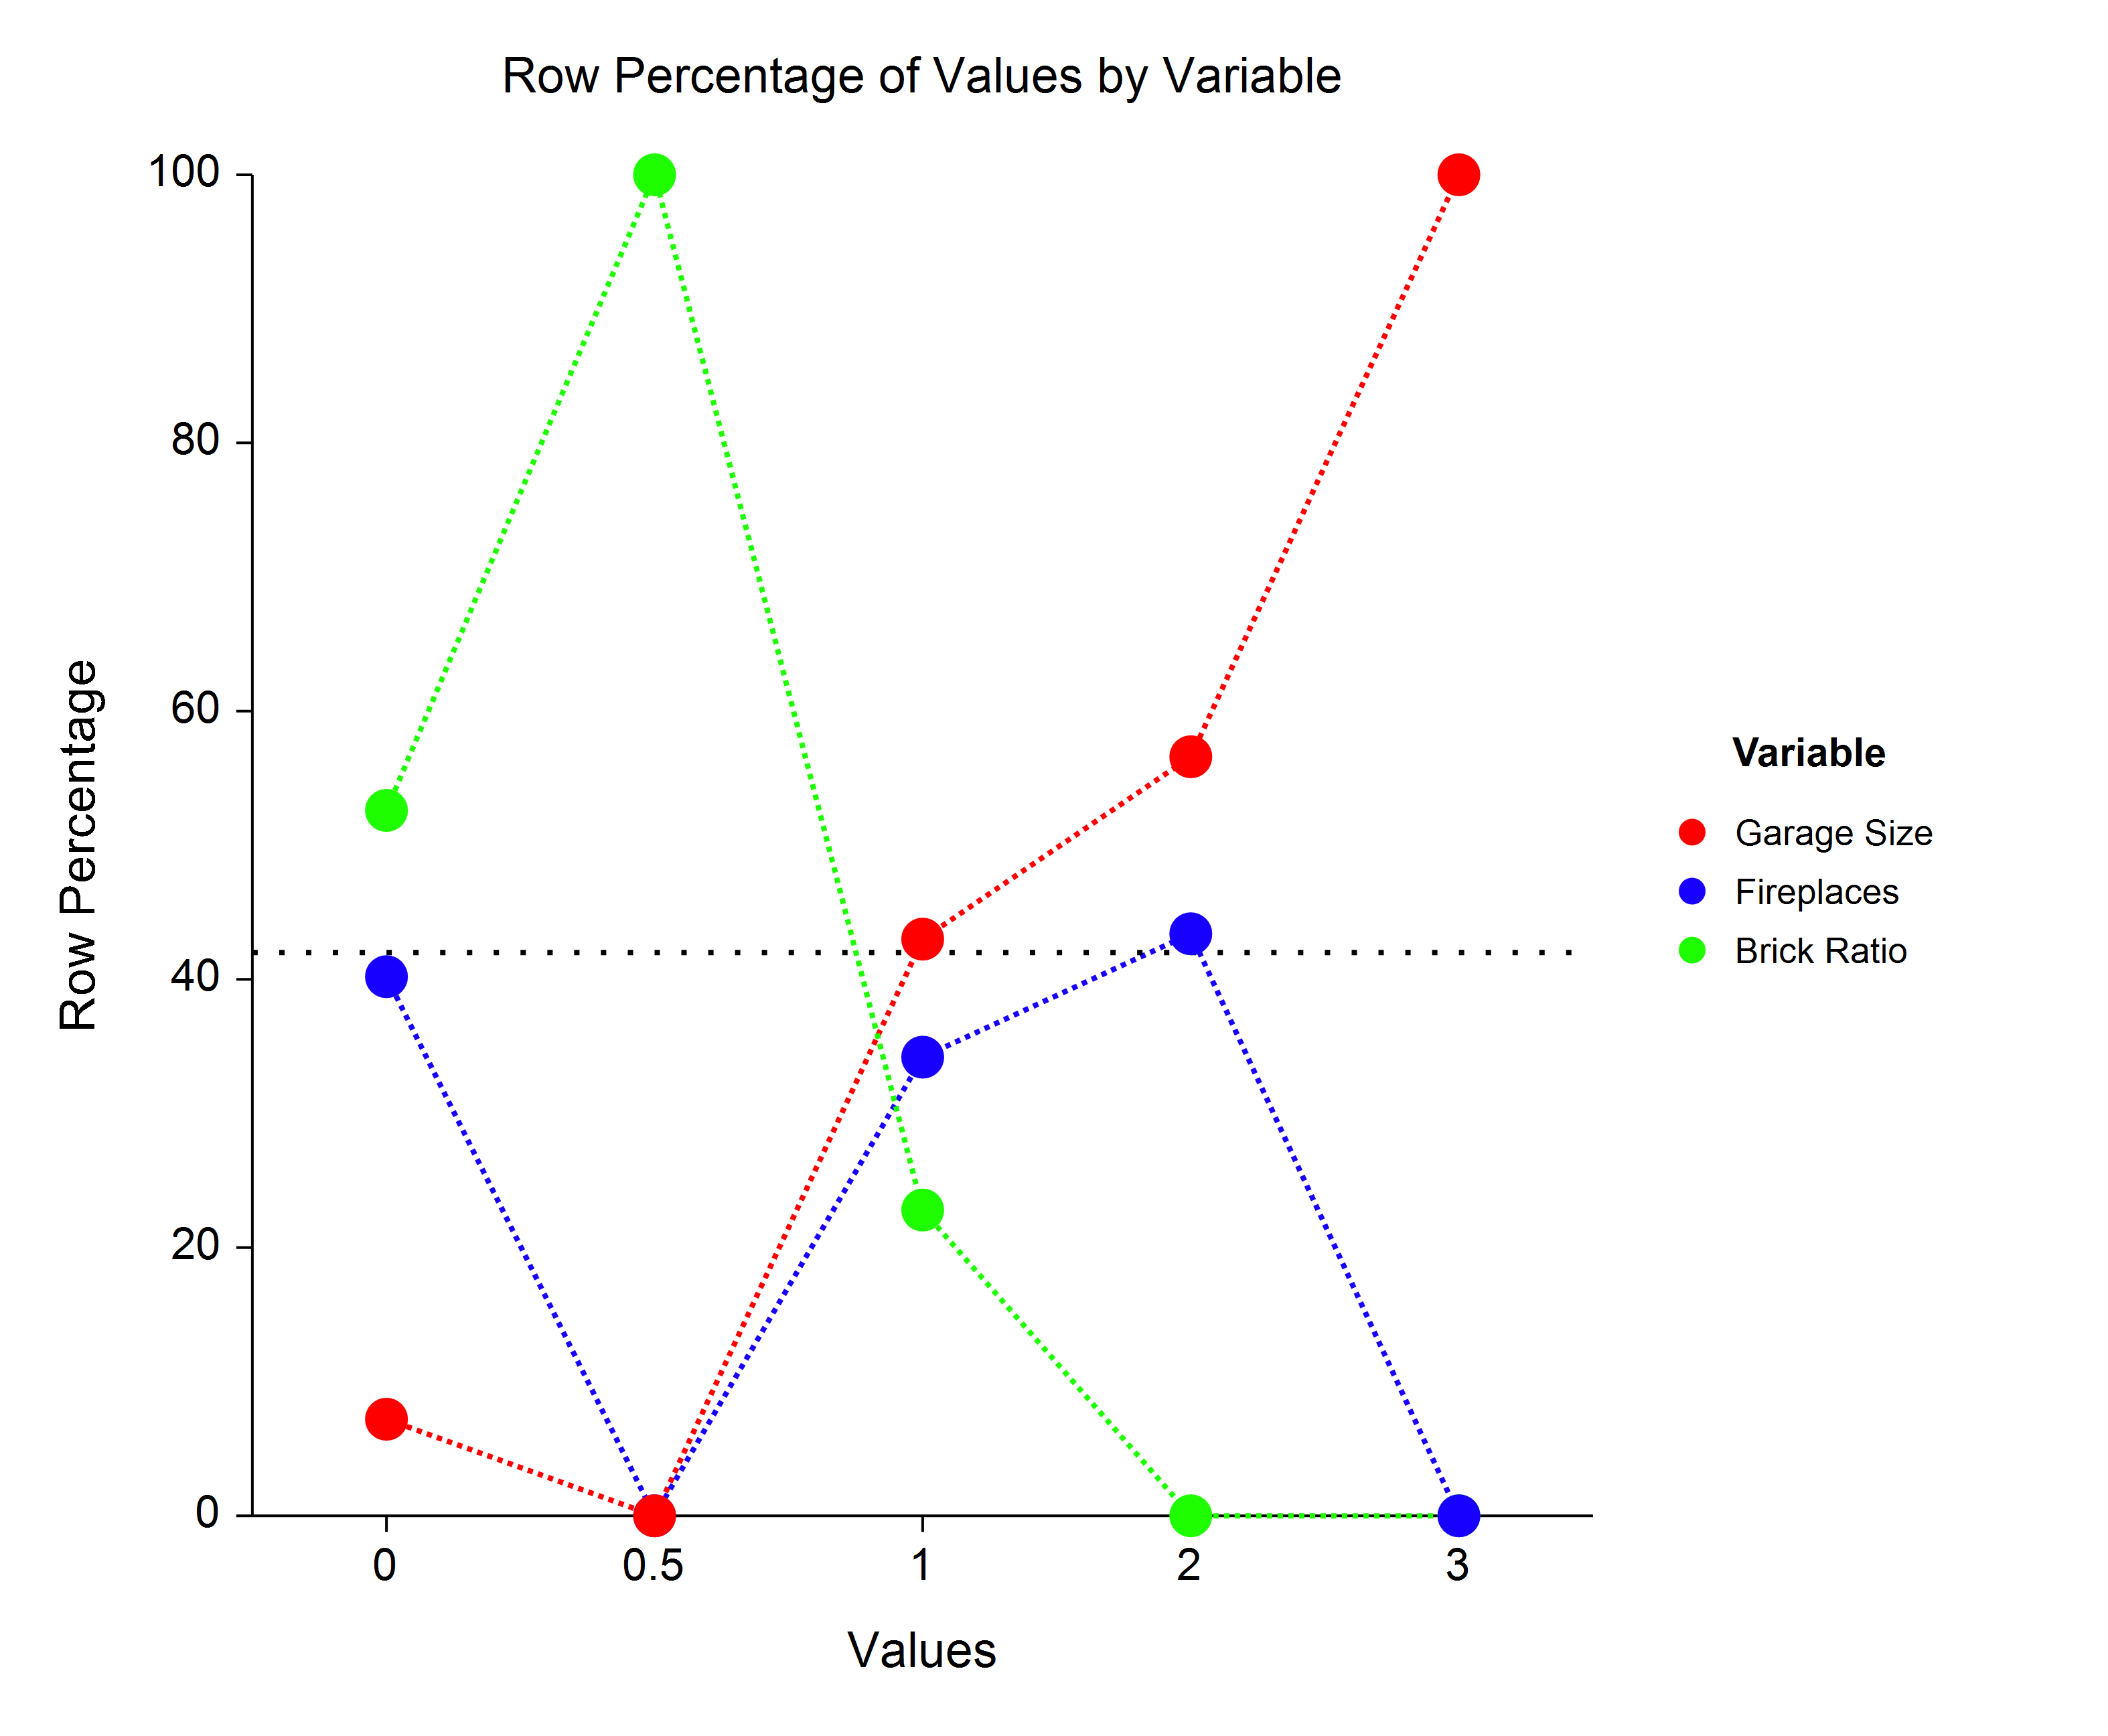
Label Sorting and Improved Data Orientation Options
The ability to order the labels was added, as well as an improved data orientation option, for the following procedures.- 4 Bar Charts procedures
- 4 Line Charts procedures
- Pie Charts
Overall Regression Line
The ability to add an overall regression line was added to the following procedures.- Scatter Plots
- Scatter Plots with Error Bars
- Bland-Altman Plots
Overall Regression Line Example
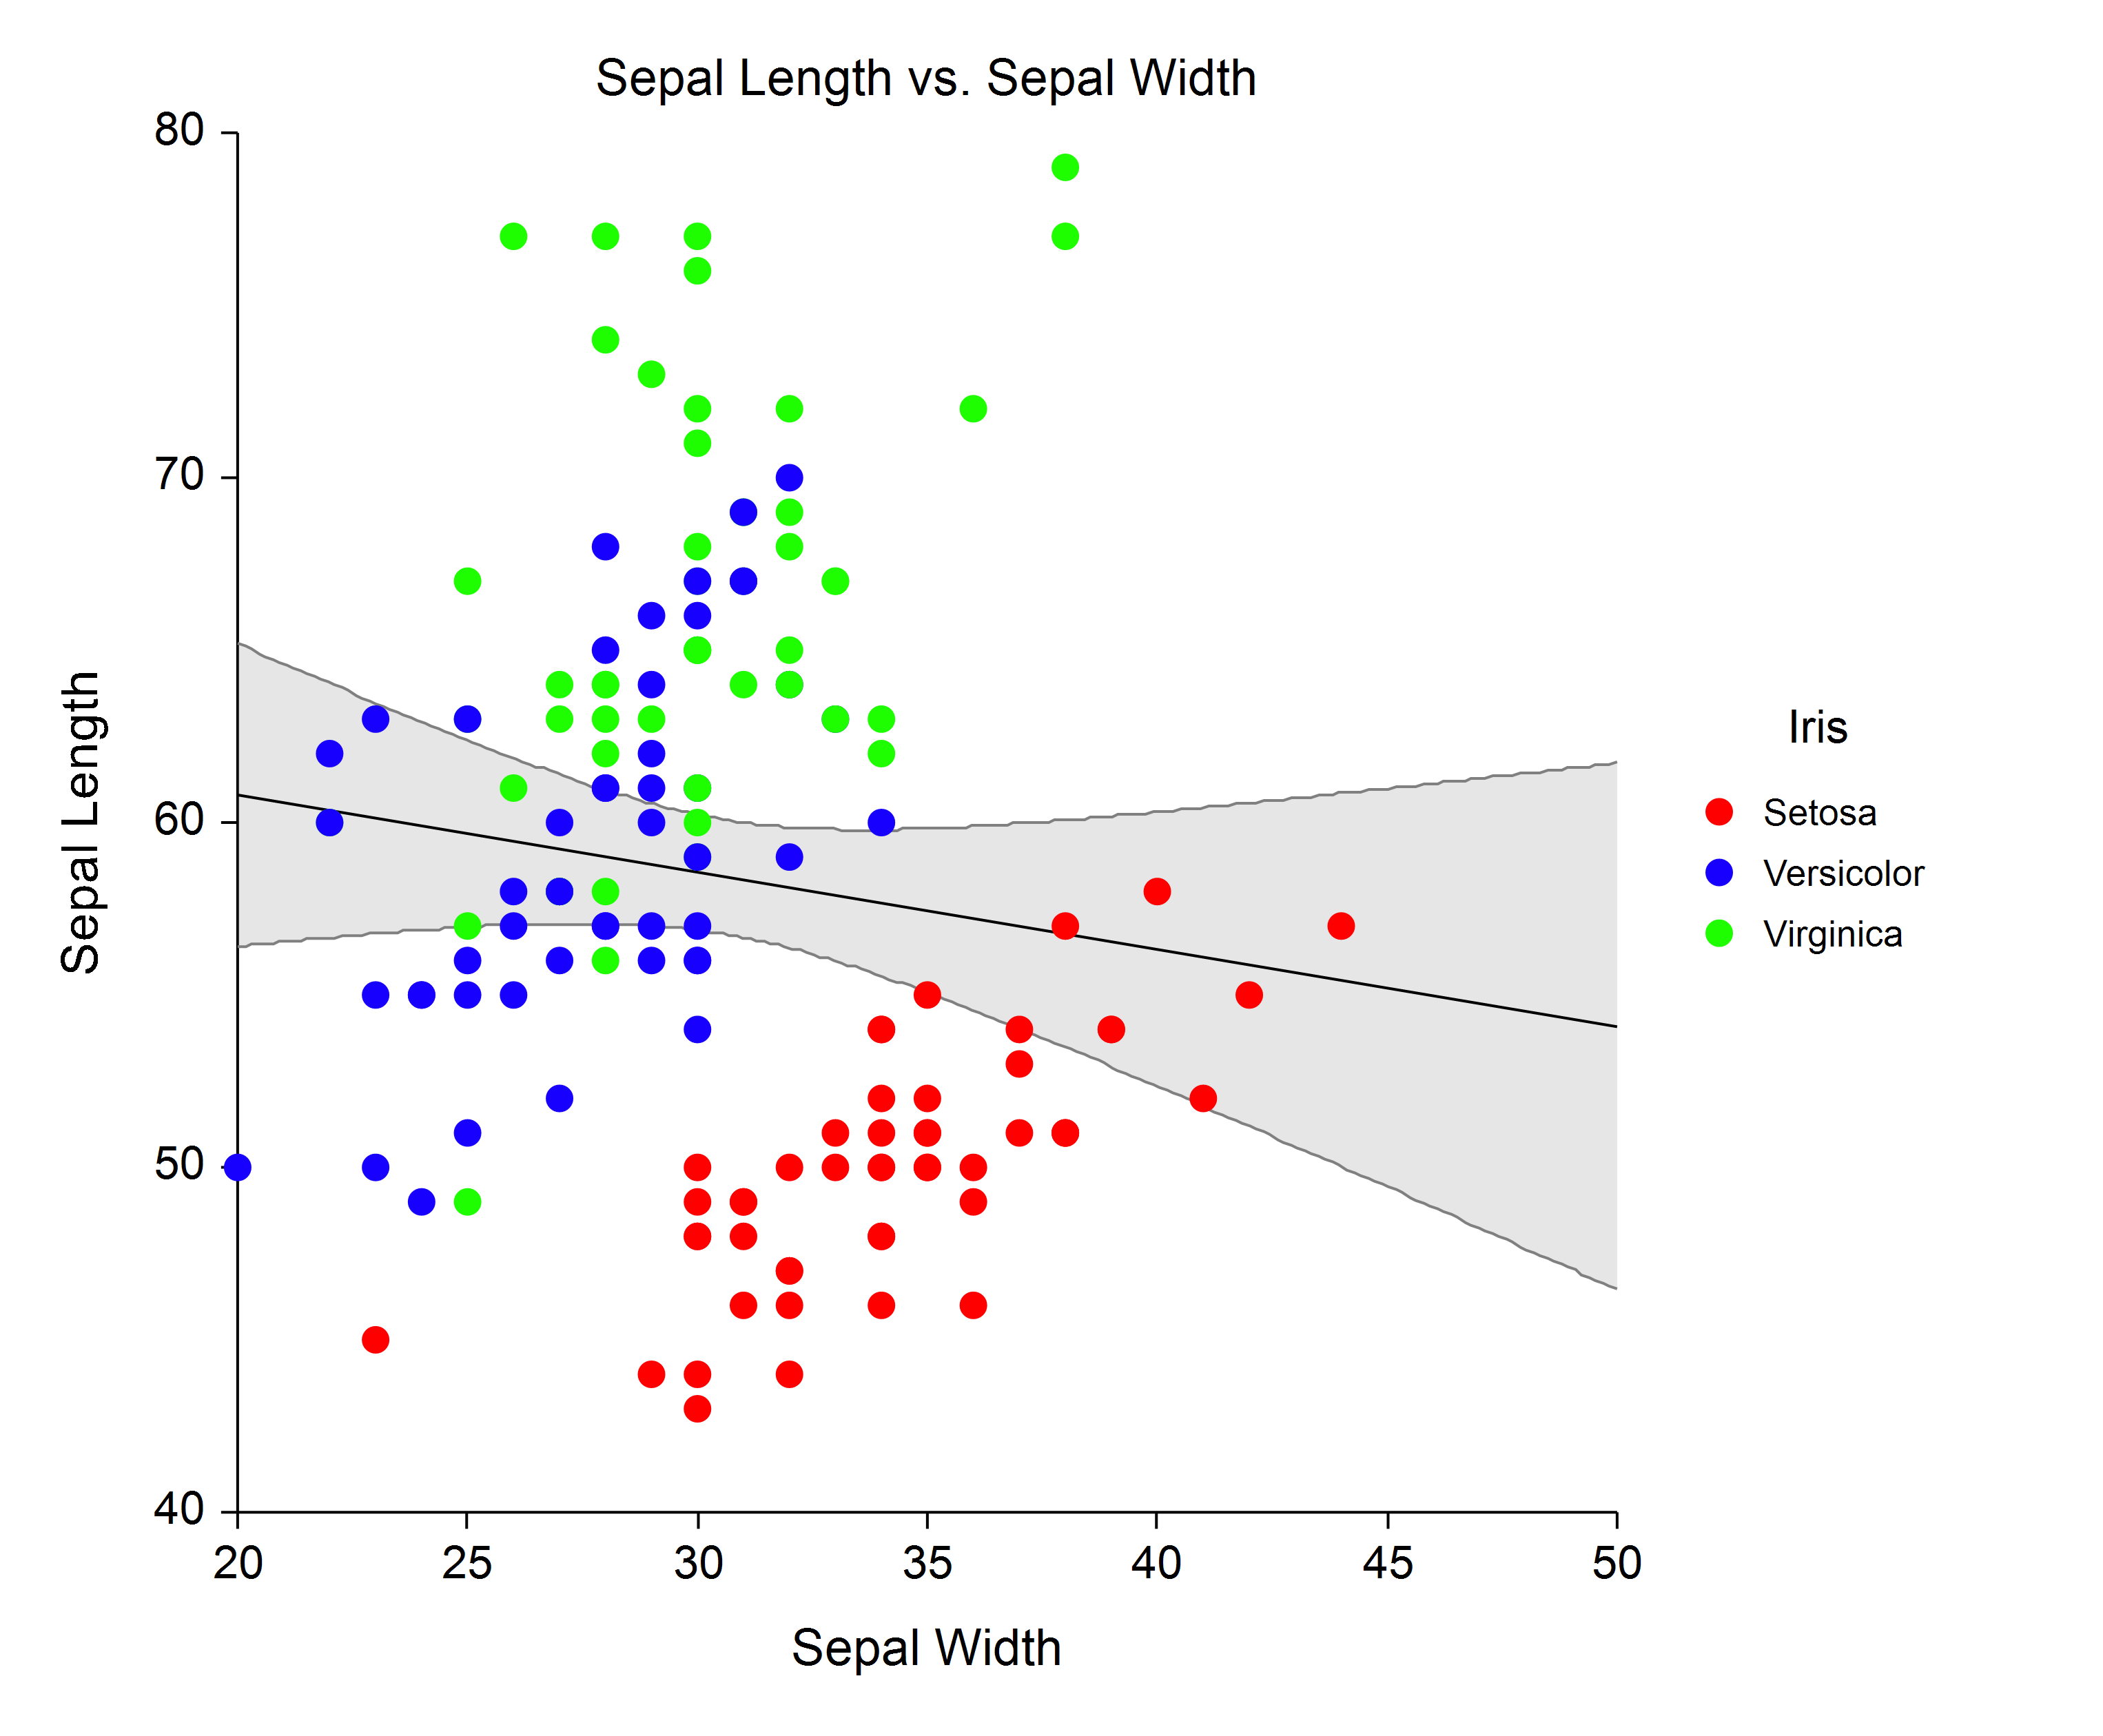
Residual Normality Tests
The following Normality tests of the residuals were added to the One-Way ANOVA procedure.- Shapiro-Wilk
- Anderson-Darling
Exact Binomial McNemar Test
The Exact Binomial McNemar Test was added to the Two Correlated Proportions (McNemar Test) procedure.Machine Zero in Mixed Models Procedures
The Mixed Models procedures were updated to allow the local setting of the machine zero, so that the local machine zero can override the global machine zero. This allows local control of the machine zero when attempting to obtain model convergence.Enhancements in NCSS 2021
Variable Labels and Value Labels
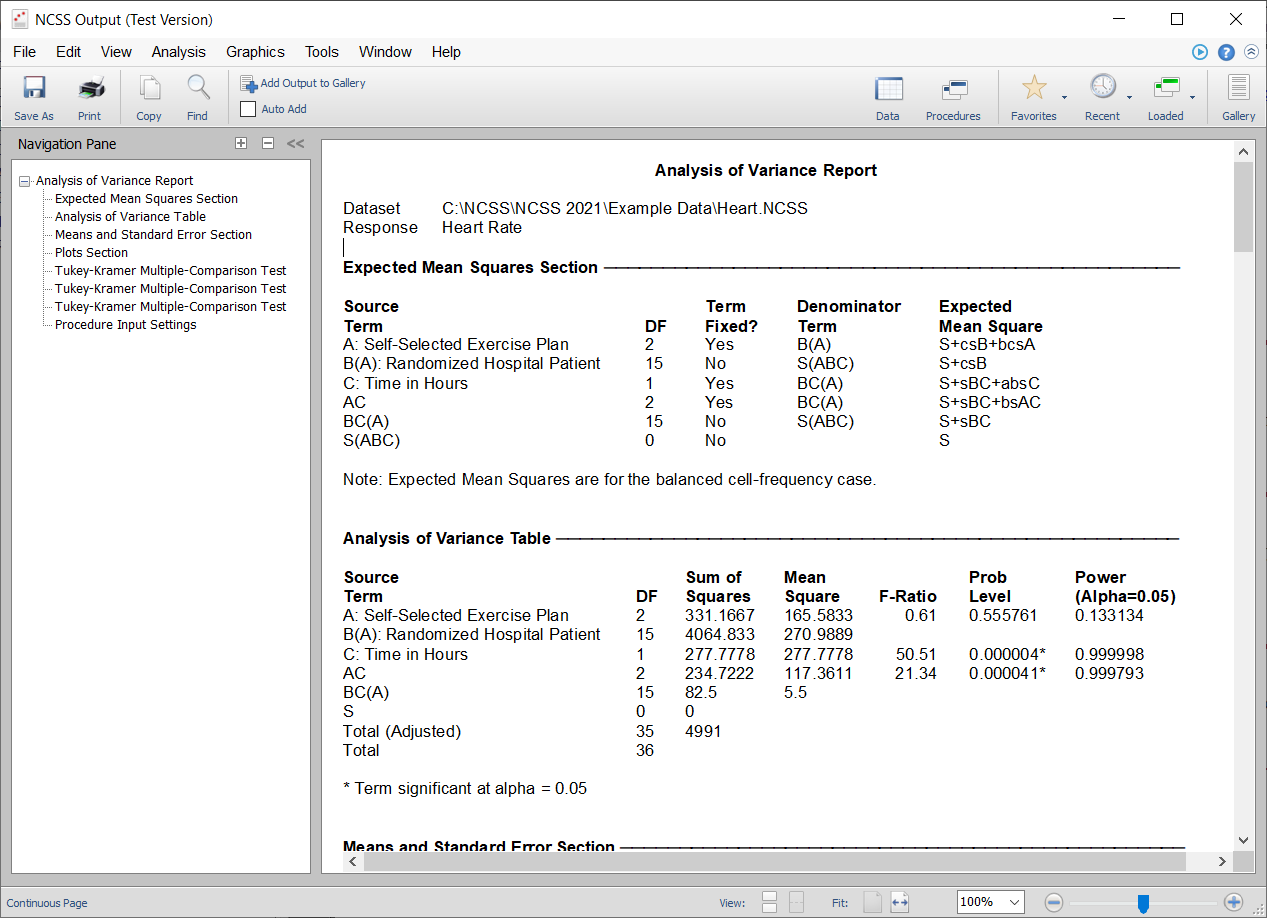
A much-improved system for the use of variable labels and value labels was implemented system-wide.Report Auto-sizing
A program-wide auto-sizing of report columns was integrated, giving improved column spacing in reports.Output Example (Before)
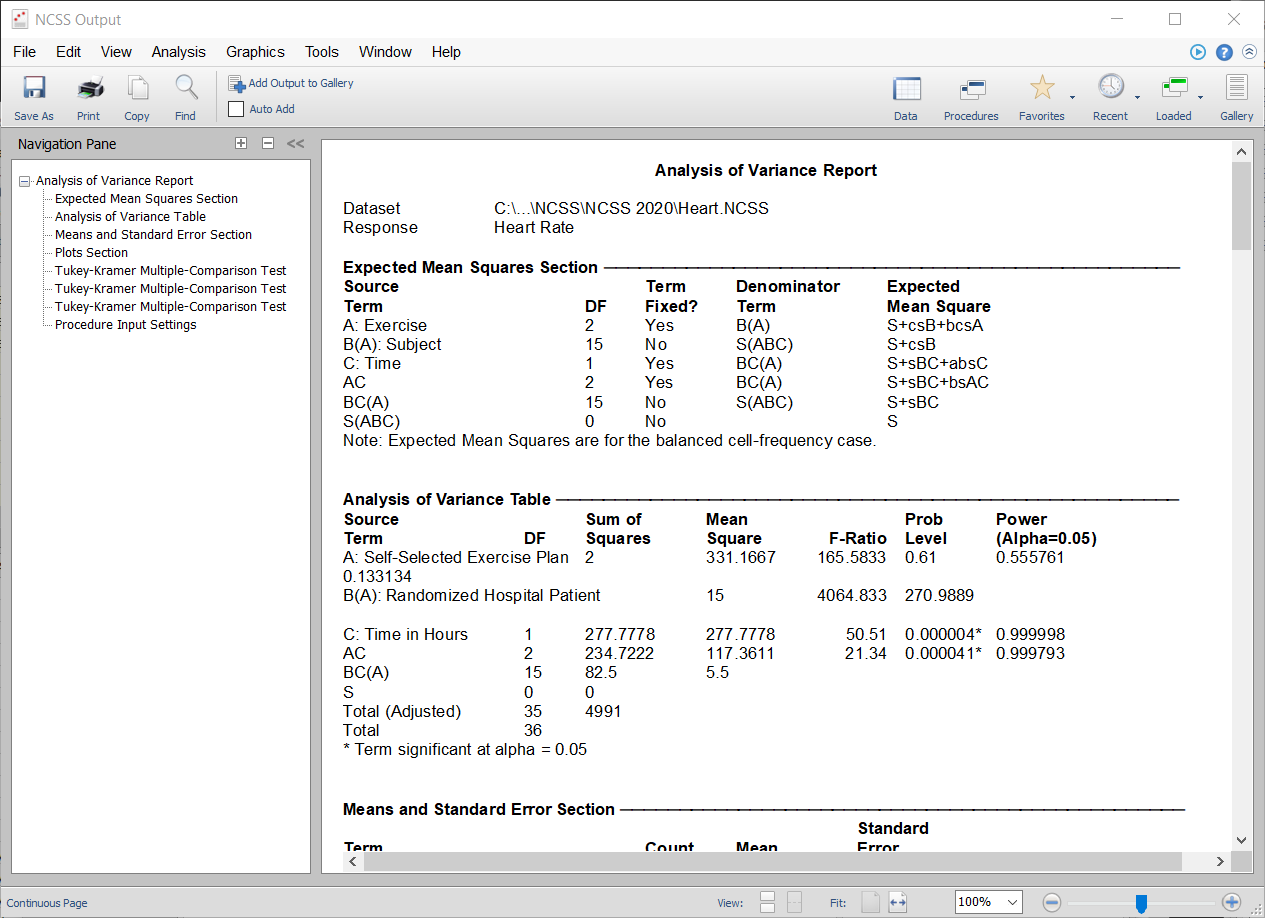
Output Example (After)
Group By System
The new Group By system allows any analysis to be run independently for each value of the designated Group By column(s).Group By System Setup Example
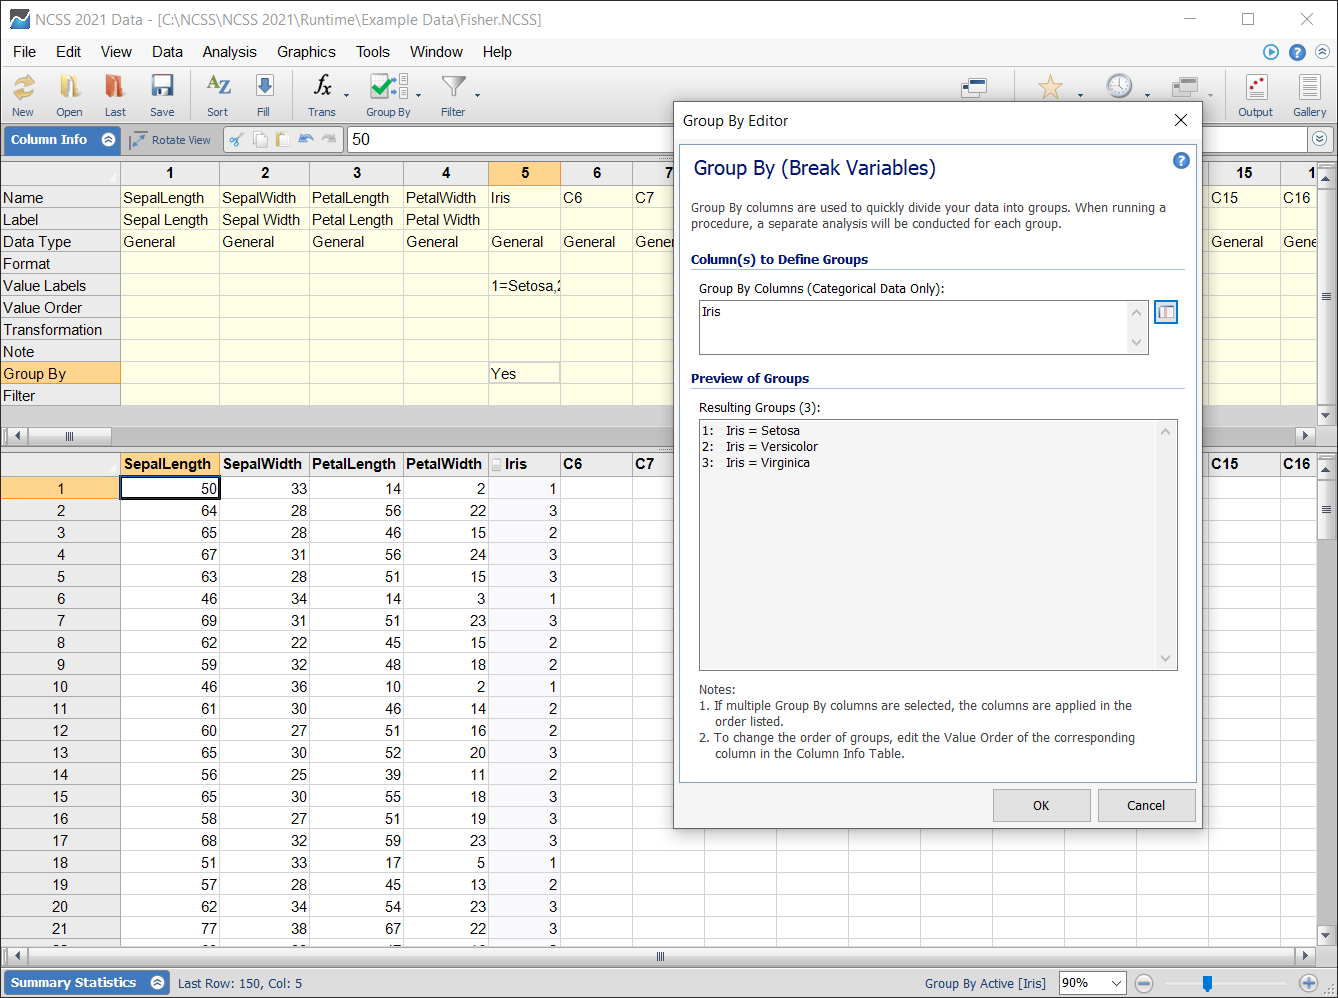
Group By System Result Example
With the Group By system active, a separate run is made for each level of Iris.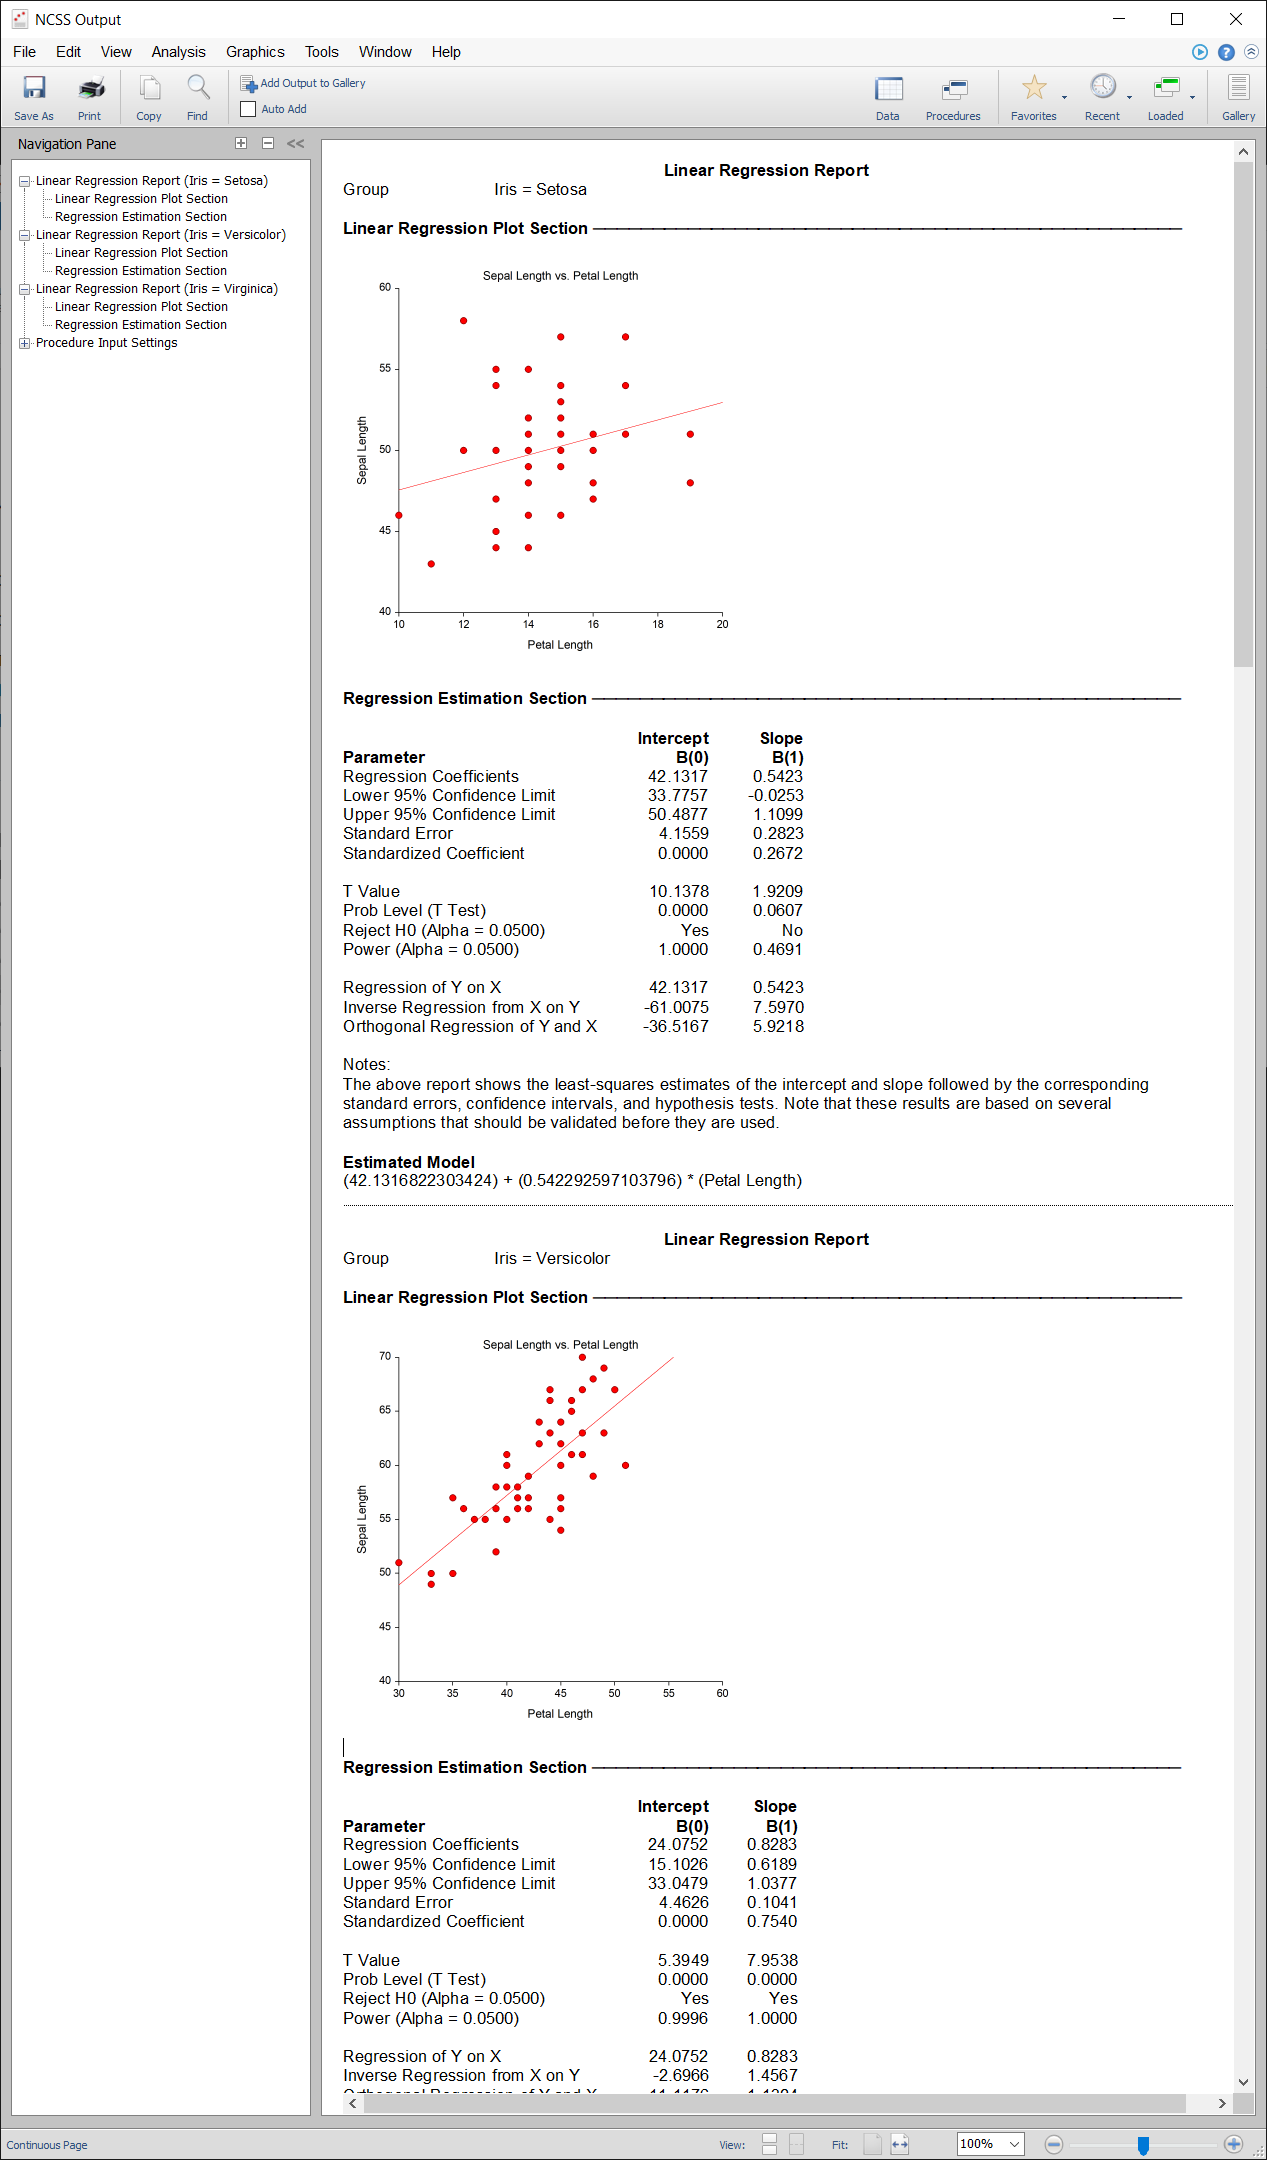
Data Fill Tool
The Data Fill tool was updated to save the current settings when the window is closed.Window Access Improvements
Improved access to various controls is given for the following scenarios.- Filter and Group By controls were added to the Procedure Window
- Report Options Dropdown was added to the Procedure Window toolbar
- Filter Dropdown was added to the Procedure Window toolbar
- Group By Dropdown was added to the Procedure Window toolbar
- Transformation Dropdown was added to the Data Window toolbar
- Output/Gallery Window menu and toolbar were updated
Window Loading Time
Some optimization techniques were employed to improve the loading time of various windows.Procedures added in the NCSS 2020 Upgrade from NCSS 2019
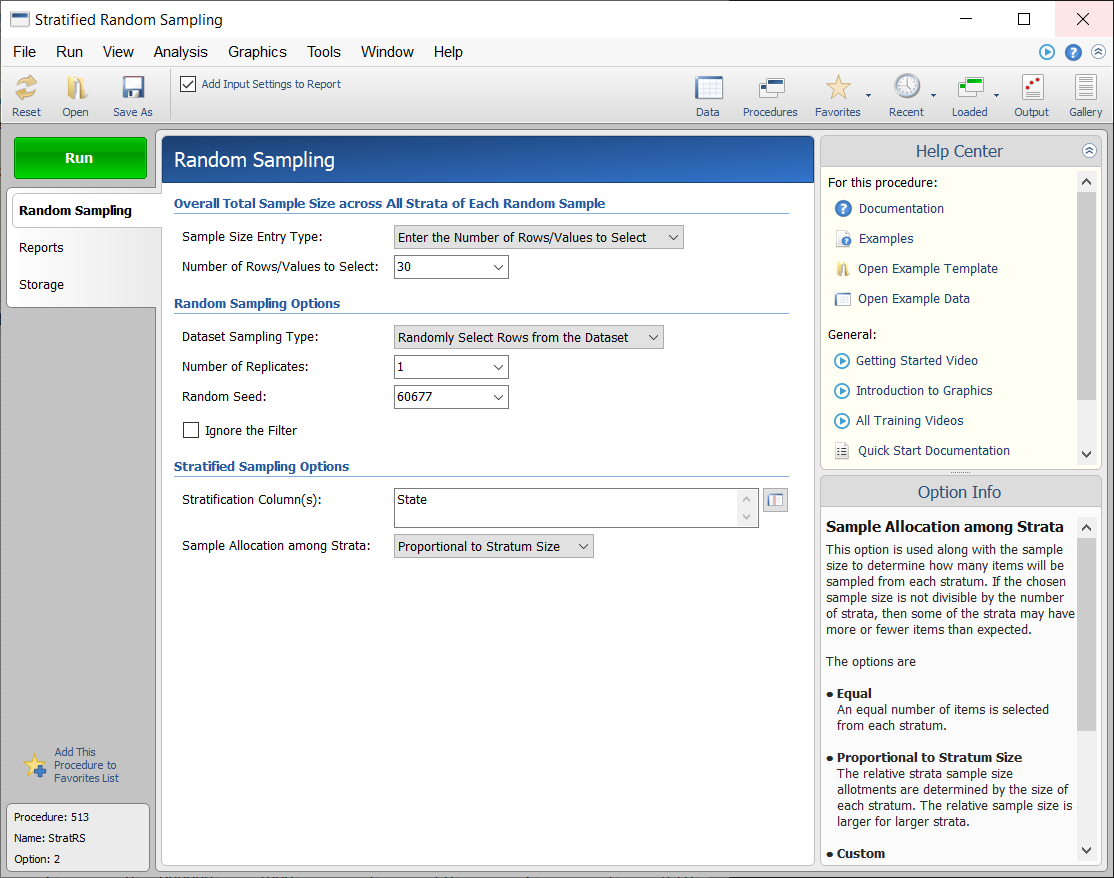
Random Sampling
- Simple Random Sampling
- Stratified Random Sampling
- Simple Random Sampling with Group Assignment
- Stratified Random Sampling with Group Assignment
Stratified Random Sampling Input Example
Group-Sequential Tests (Futility Boundary Options, Sample Size Re-estimation)
For each of these group-sequential analysis and sample-size re-estimation procedures, there are corresponding group-sequential power and sample size procedures in PASS 2020.- Group-Sequential Analysis for Two Hazard Rates
- Group-Sequential Non-Inferiority Analysis for Two Hazard Rates
- Group-Sequential Superiority by a Margin Analysis for Two Hazard Rates
- -
- Group-Sequential Non-Inferiority Analysis for Two Means with Known Variances
- Group-Sequential Superiority by a Margin Analysis for Two Means with Known Variances
- Group-Sequential Non-Inferiority T-Tests for Two Means
- Group-Sequential Superiority by a Margin T-Tests for Two Means
- -
- Group-Sequential Non-Inferiority Analysis for Two Proportions
- Group-Sequential Superiority by a Margin Analysis for Two Proportions
- -
- Group-Sequential Analysis for One Mean with Known Variance
- Group-Sequential T-Tests for One Mean
Procedures that were Updated and/or Improved in NCSS 2020
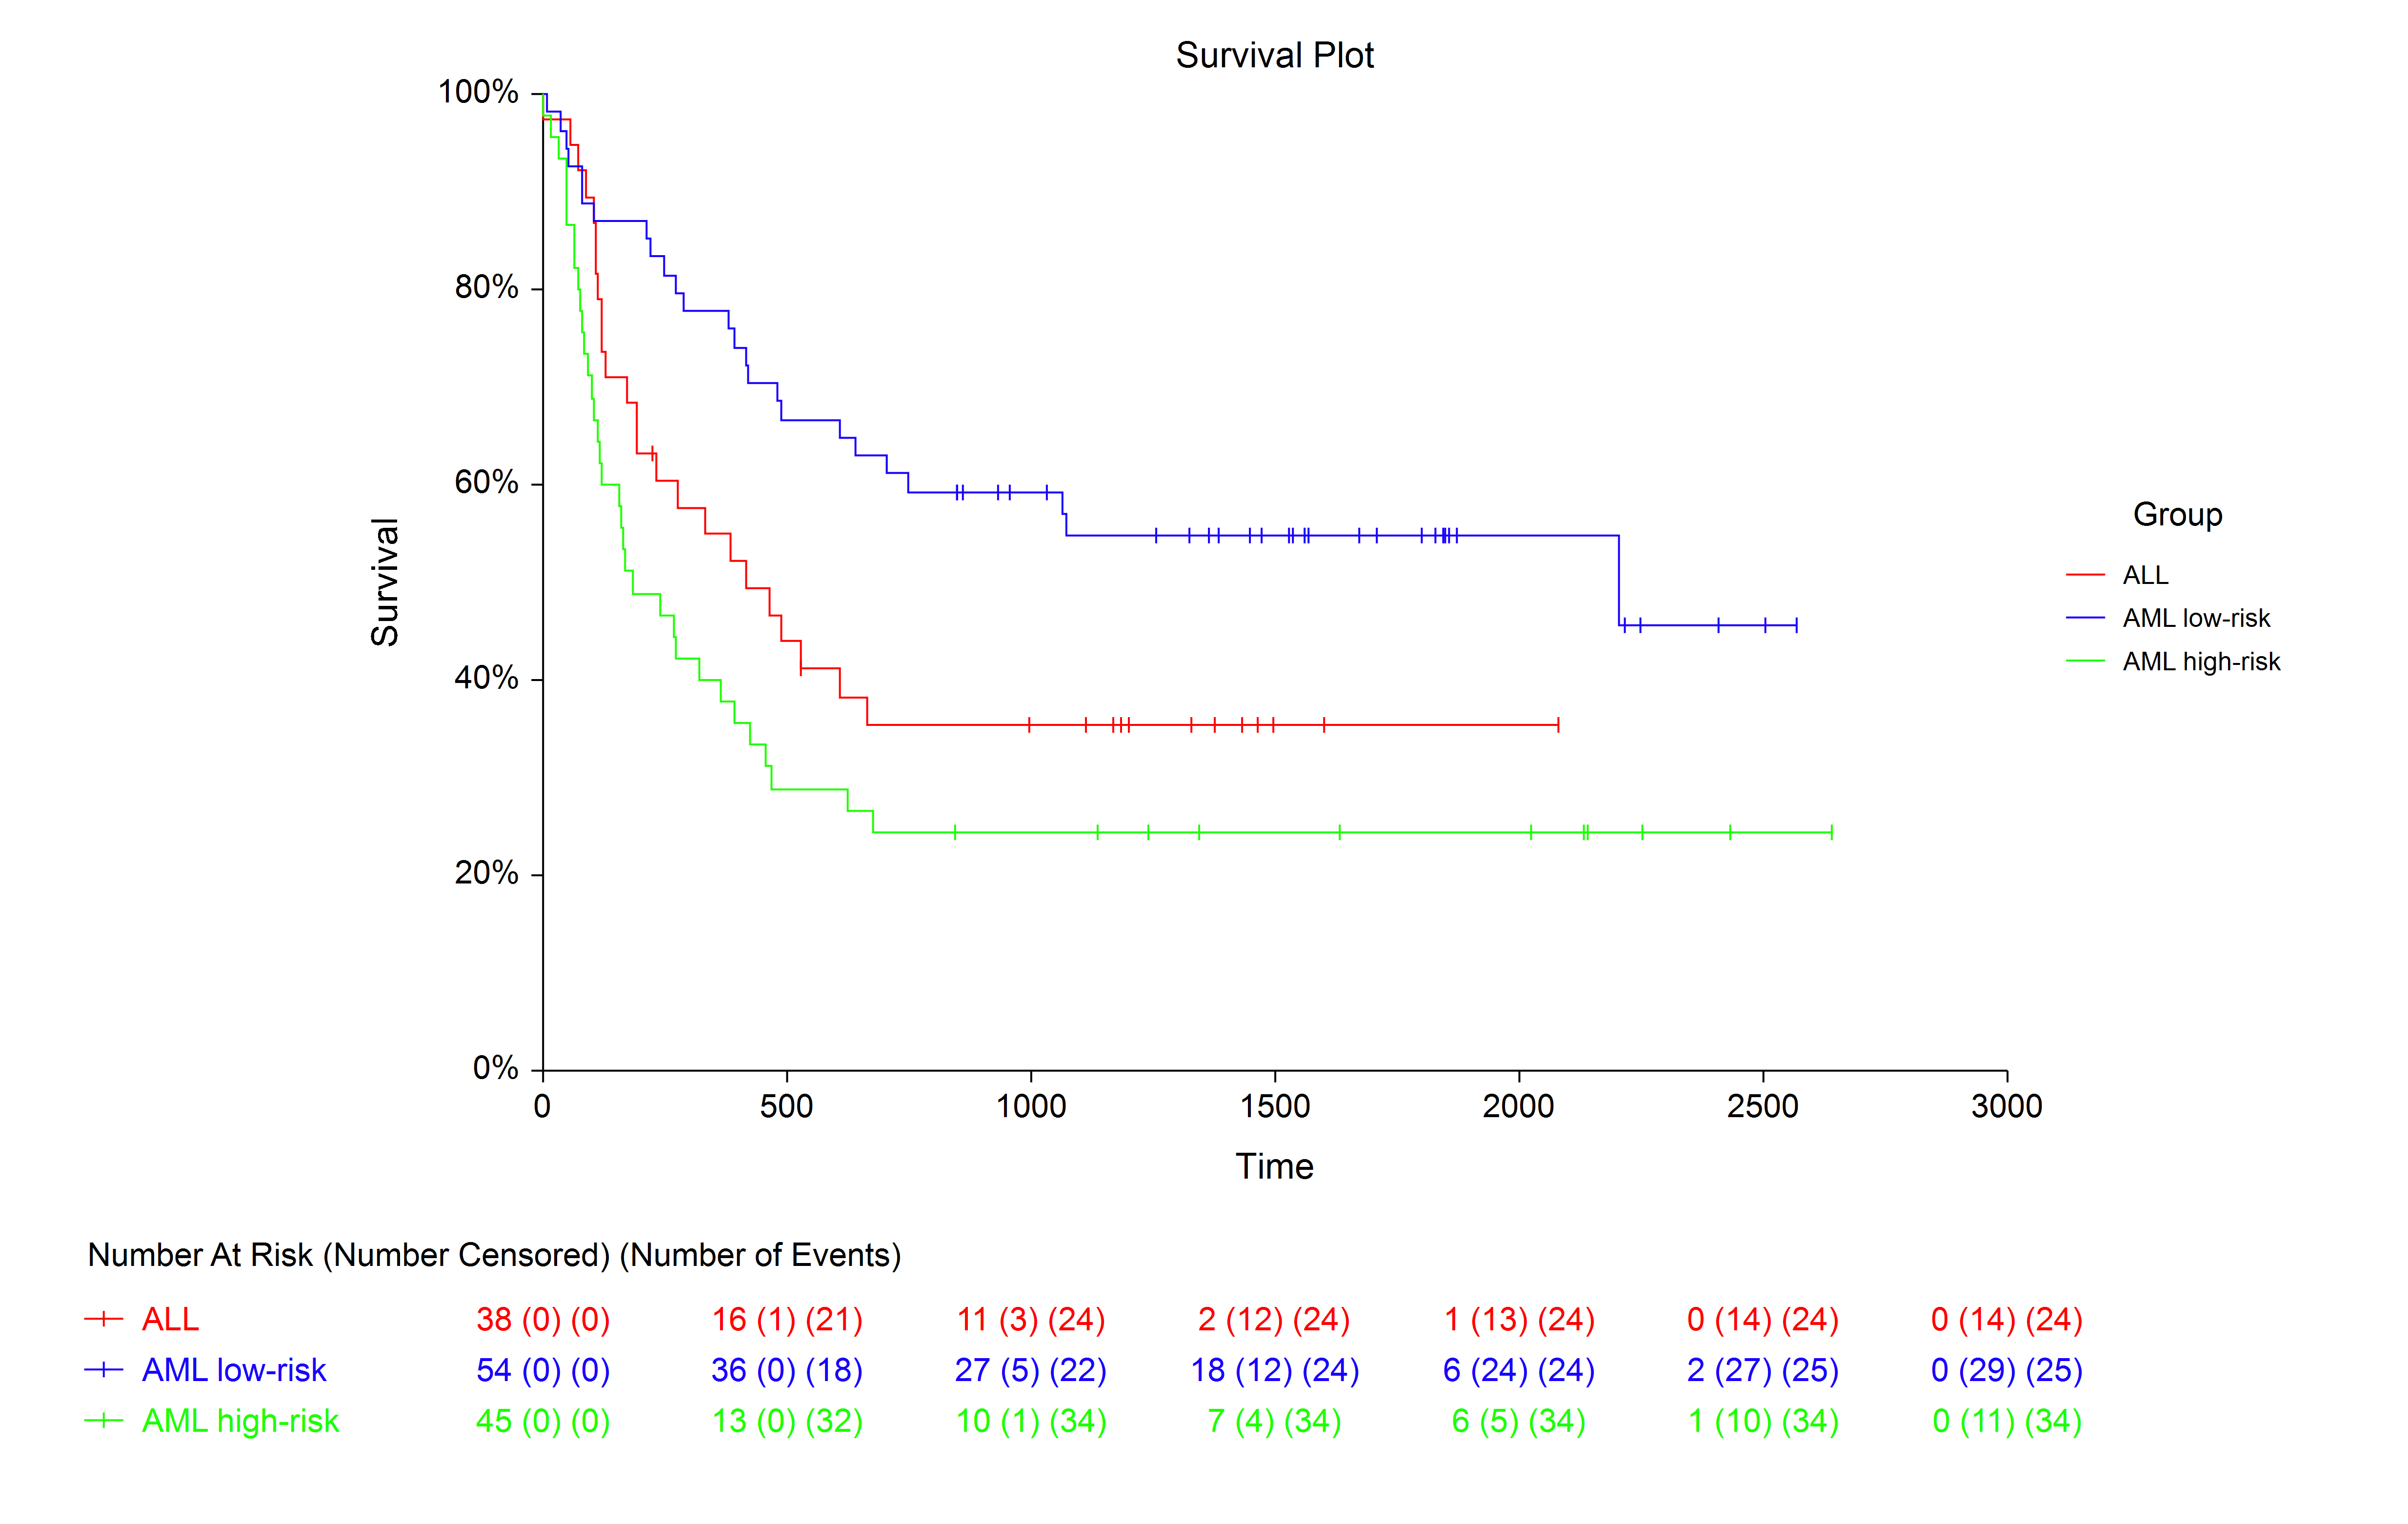
These procedures have been updated to improve functionality and flexibility.At-Risk Tables in Survival/Reliability Procedures
For each of these procedures, at-risk tables were added to the survival-type plots. Additional input and output improvements were also made.- Kaplan-Meier Curves (Logrank Tests)
- Life-Table Analysis
- Cumulative Incidence
- Gamma Distribution Fitting
- Beta Distribution Fitting
- Distribution (Weibull) Fitting
At-Risk Table Example
Between-Group Mean Survival Comparisons (RMST and RMTL) in the Kaplan-Meier Curves (Logrank Tests) Procedure
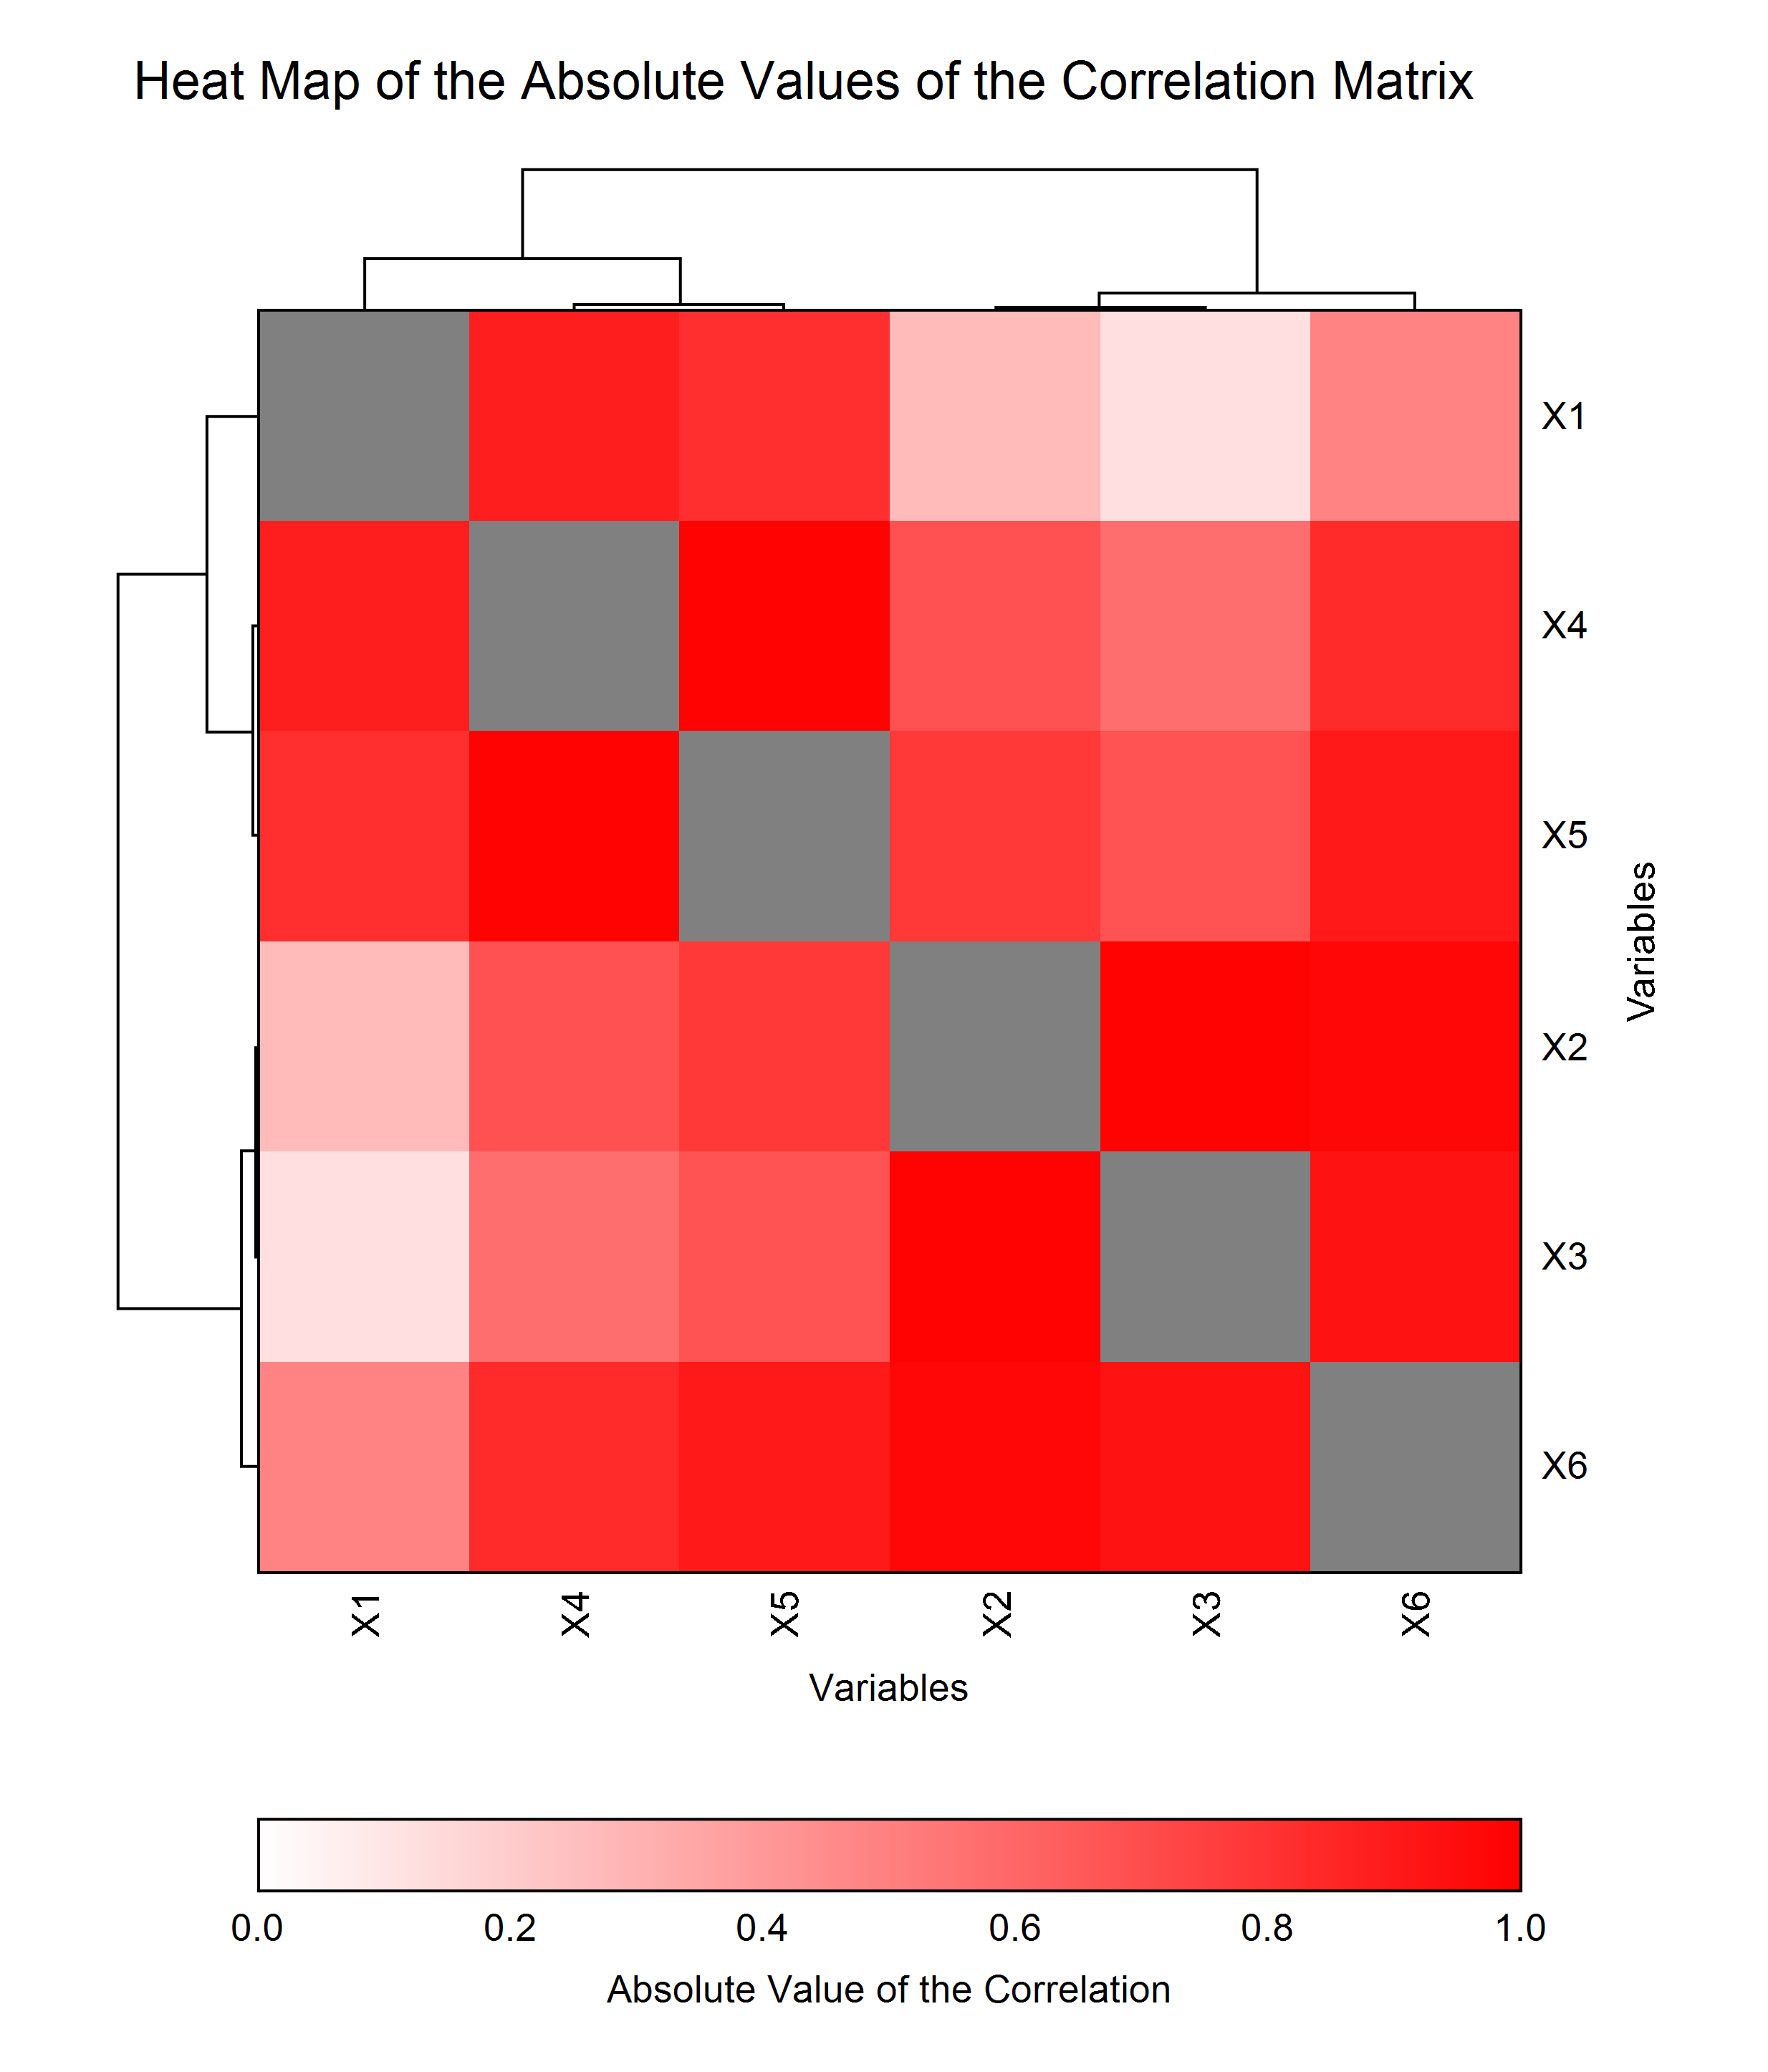
The Kaplan-Meier Curves (Logrank Tests) Procedure now computes Restricted Mean Survival Time (RMST) and Restricted Mean Time Lost (RMTL) statistics, along with pairwise difference and ratio comparisons among groups.Heatmaps in Factor Analysis and PCA Procedures
Visual interpretation was improved in these procedures by adding heatmaps to the output. Additional examples were added as well.- Factor Analysis
- Principal Components Analysis
Heatmap Example
Contingency Tables (Crosstabs / Chi-Square Test)
In the Contingency Tables (Crosstabs / Chi-Square Test) procedure, the Tukey-Pairwise and Dunnett's Many-to-one (control) multiple comparisons results were added. These include the adjustments suggested by Agresti and Caffo (2000). Both p-values and confidence limits for Wald and Score tests are now included.Randomization Lists
A variety of improvements were made to the Randomization Lists procedure, including block randomization, the option of specifying a random seed, group titles, sample size entry options, and strata specification.Enhancements
Memory
A major memory performance enhancement was integrated into the spreadsheet, resulting in up to a 70% decrease in required memory.Standardized Range Distribution
Improved algorithms for the Standardized Range probability distribution were integrated, to improve accuracy.Additions and Improvements in the NCSS 2019 Upgrade from NCSS 12
Group-sequential analysis was introduced, along with Mediation analysis and many improvements.Procedures Added in NCSS 2019
Group-Sequential Tests (Futility Boundary Options, Sample Size Re-estimation)
For each of these group-sequential analysis and sample-size re-estimation procedures, there are corresponding group-sequential power and sample size procedures in PASS 2019.- Group-Sequential Analysis for Two Means with Known Variances
- Group-Sequential T-Tests for Two Means
- Group-Sequential Analysis for Two Proportions
Mediation Analysis
- Mediation Analysis
Mediation Analysis Output Example

Updated and/or Improved Procedures in NCSS 2019
These procedures were updated to improve functionality and flexibility.- Frequency Tables
- Correlation Matrix
Frequency Tables Procedure
In the Frequency Tables procedure, one can now sort the frequency table by count. Additional bar charts and pie charts were also added.
Correlation Matrix Procedure
More correlation statistics can be reported in a more flexible way. Heat map and eigenvector plots have also been added.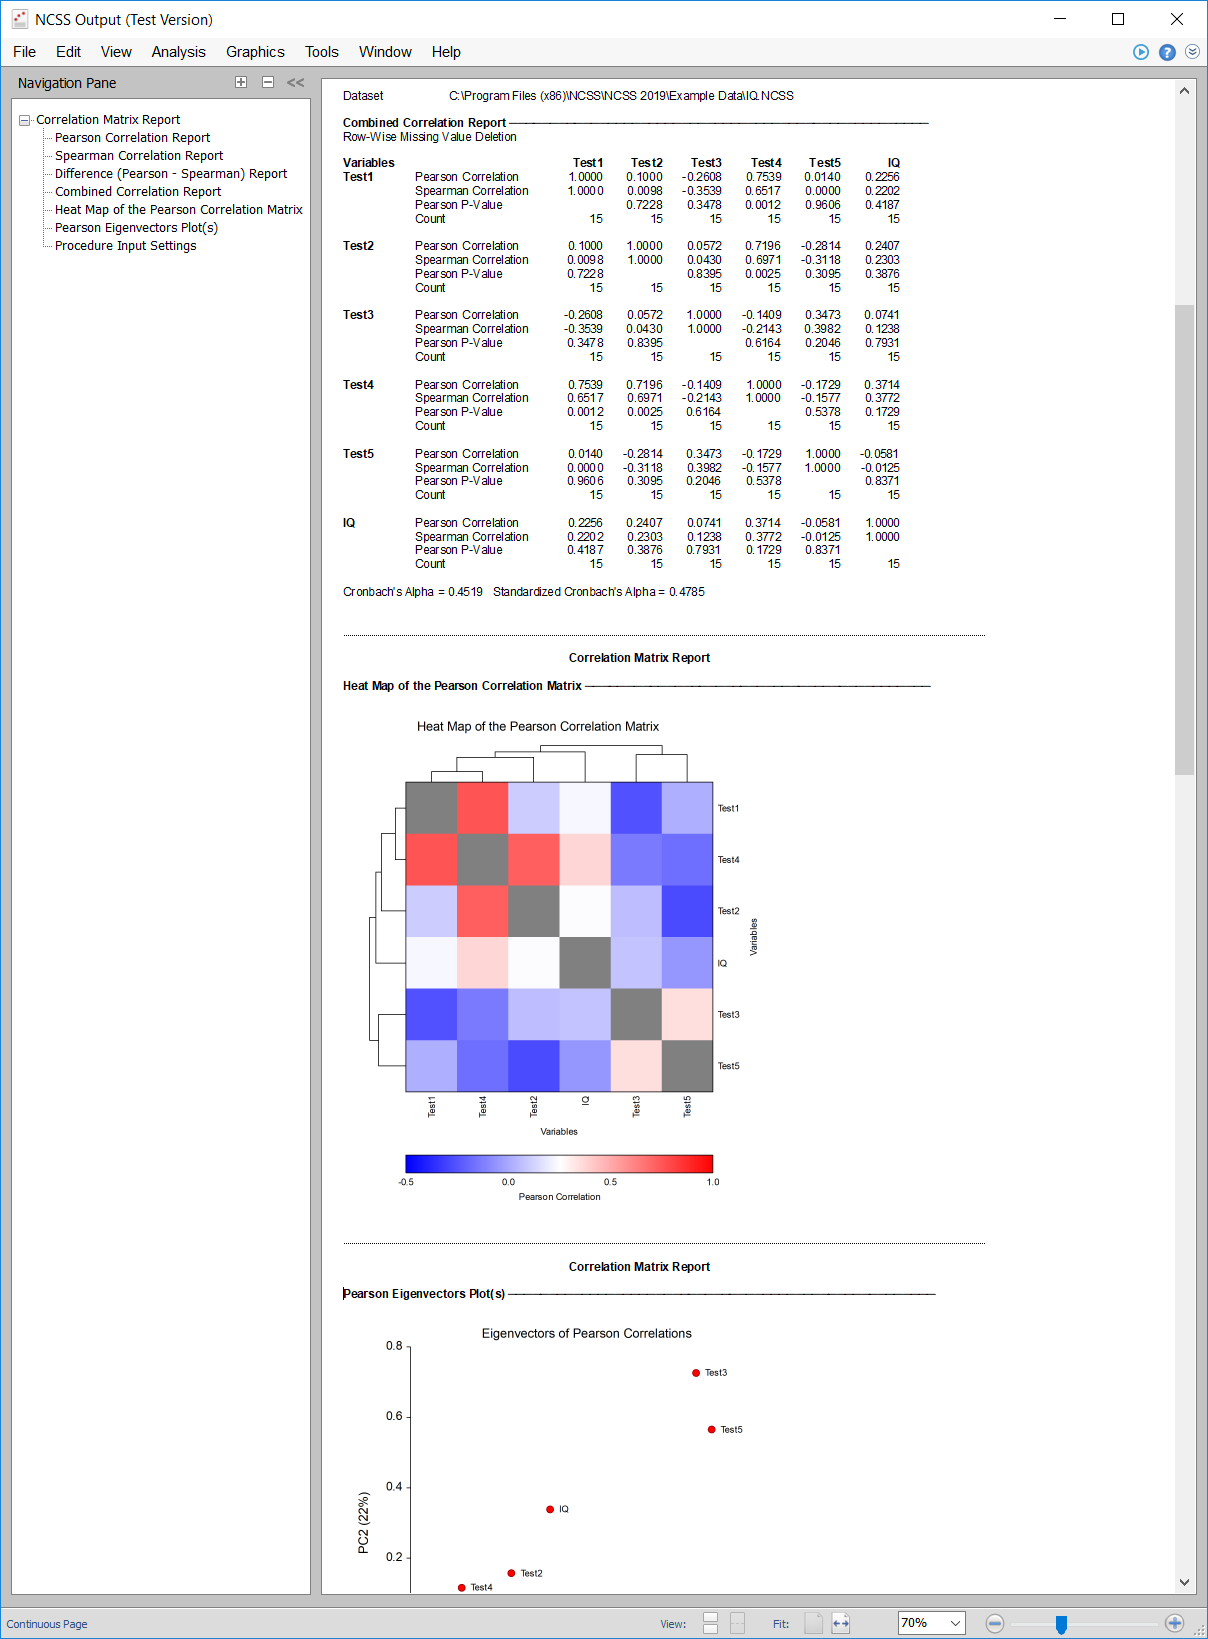
Enhancements
Numeric Axis Value Labels
The ability to substitute numeric values with value labels for numeric axis reference labels is now available for all plots with numeric axes.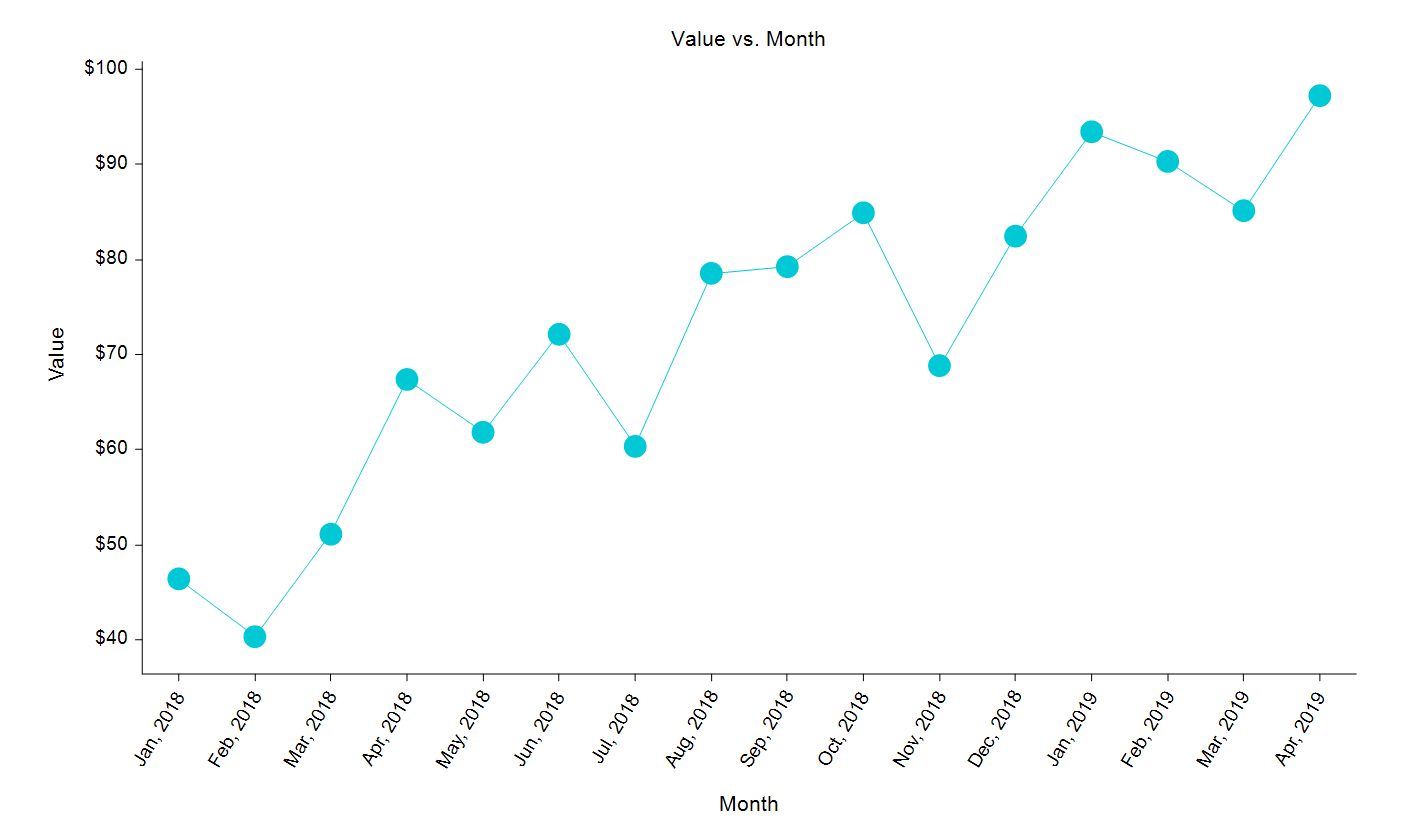
New Transformations
The following transformations have been added:- DATEDT: Returns the date portion of a date-time value.
- TIMEDT: Returns the time portion of a date-time value.
- RANDOMSAMPLEROWS: Creates a binary indicator variable by randomly selecting k non-empty rows.
- RANDOMSAMPLEBIN: Creates a binary indicator variable by randomly selecting k values from a column.
- RANDOMSAMPLE: Returns a random sample of k values from a column.
- FIRSTDIFF: Returns the first-order differencing of a column (D1[i] = X[i] - X[i-1]).
- SECONDDIFF: Returns the second-order differencing of a column (D2[i] = X[i] - 2X[i-1] + X[i-2]).
- LOESS: Returns the smoothed Loess regression values based on Y and X.
Improved Chart Headings
For many procedures, particularly regression procedures, additional headings and navigation links were added for the plots.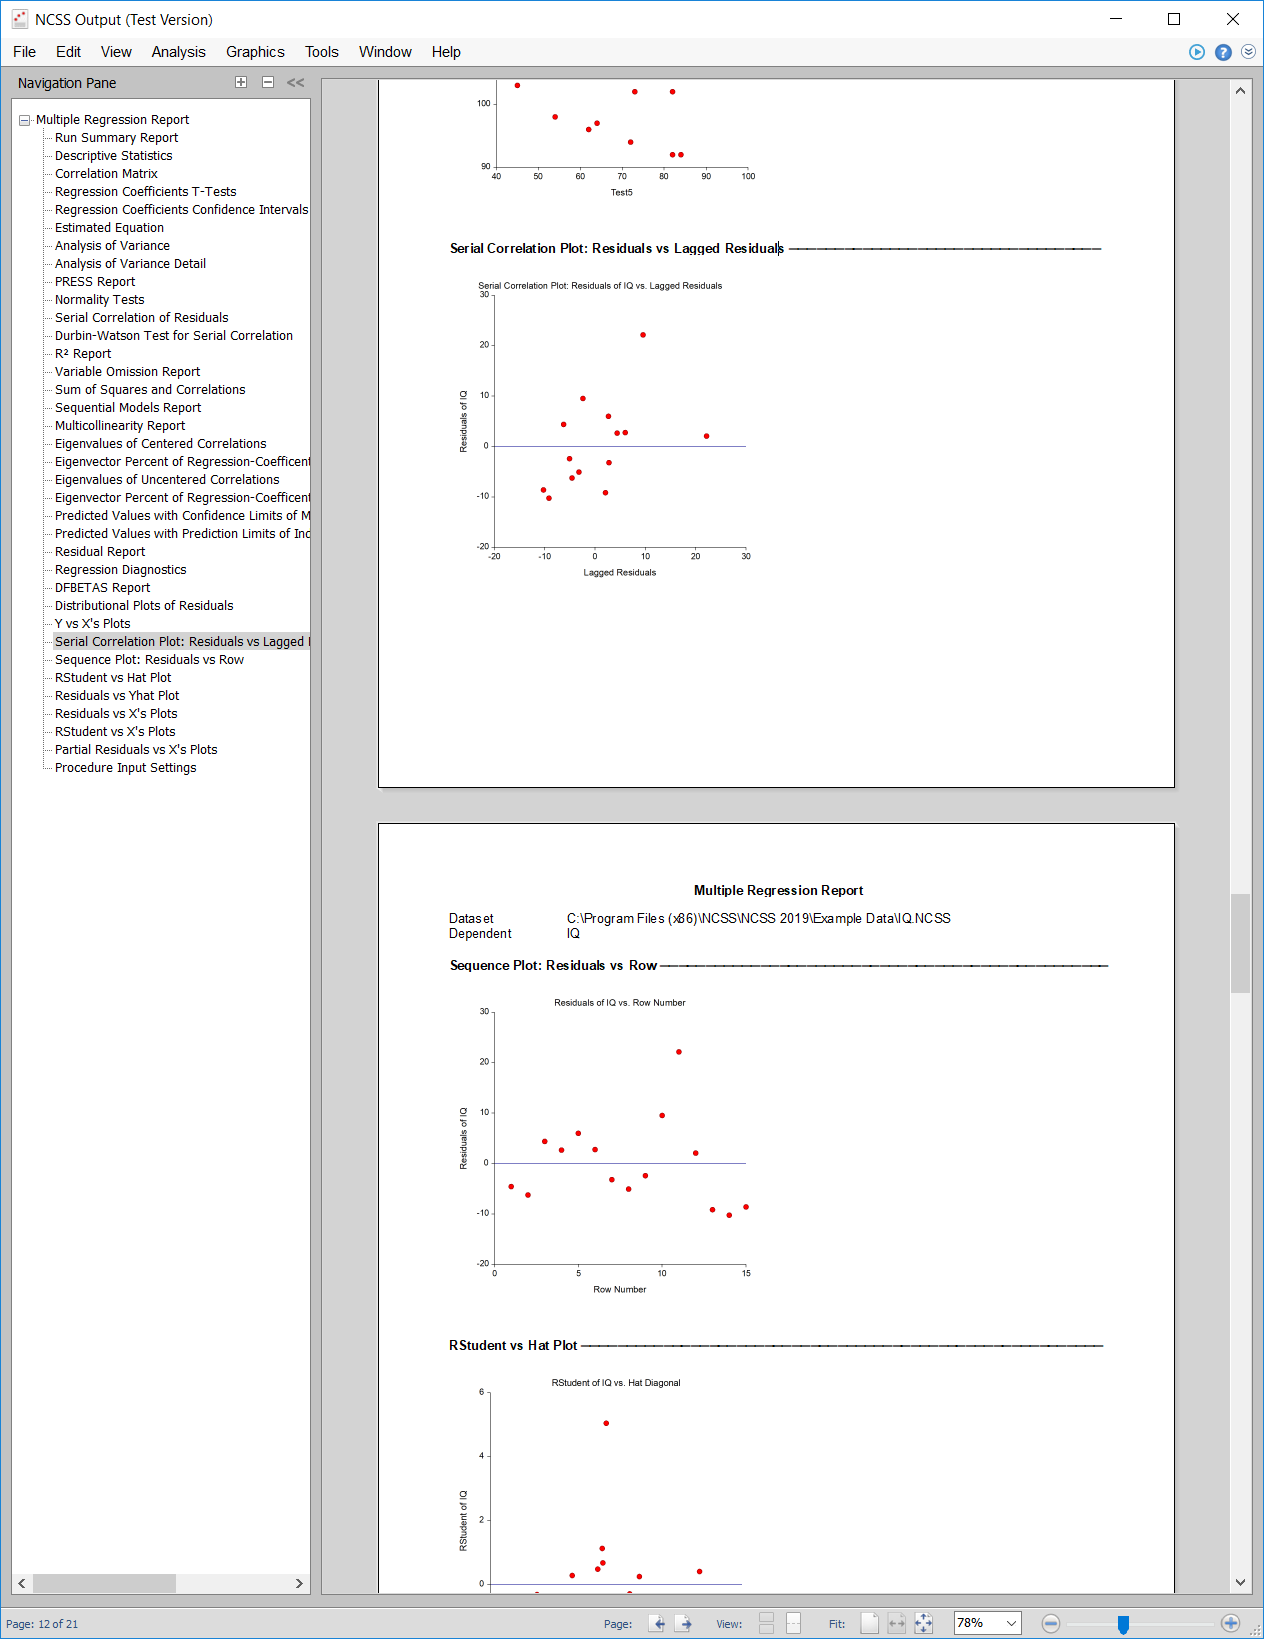
Compatibility Improvements
The underlying framework was converted to .NET 4.6 for better compatibility with Windows 10 and general compatibility improvements. This framework significantly improved the responsiveness of the 64-bit version of NCSS 2019, as well.Procedures and Enhancements added in the NCSS 12 Upgrade from NCSS 11
Many new procedures, plots, and enhancements were added in the upgrade from NCSS 11 to NCSS 12.Procedures Added in NCSS 12
- Paired T-Test for Superiority by a Margin
- One-Sample T-Test for Non-Inferiority
- One-Sample T-Test for Superiority by a Margin
- One-Sample T-Test for Equivalence
- Two-Sample T-Test for Superiority by a Margin
- -
- Analysis of 2x2 Cross-Over Designs using T-Tests for Non-Inferiority
- Analysis of 2x2 Cross-Over Designs using T-Tests for Superiority by a Margin
- Analysis of 2x2 Cross-Over Designs using T-Tests for Equivalence
- -
- One Proportion - Non-Inferiority Tests
- One Proportion - Superiority by a Margin Tests
- One Proportion - Equivalence Tests
- -
- Two-Sample Non-Inferiority Tests for Survival Data using Cox Regression
- Two-Sample Superiority by a Margin Tests for Survival Data using Cox Regression
- Two-Sample Equivalence Tests for Survival Data using Cox Regression
- -
- Cluster Randomization - Create Cluster Means Dataset
- Cluster Randomization - Create Cluster Proportions Dataset
- Cluster Randomization - Create Cluster Rates Dataset
- -
- General Linear Models (GLM) for Fixed Factors
- -
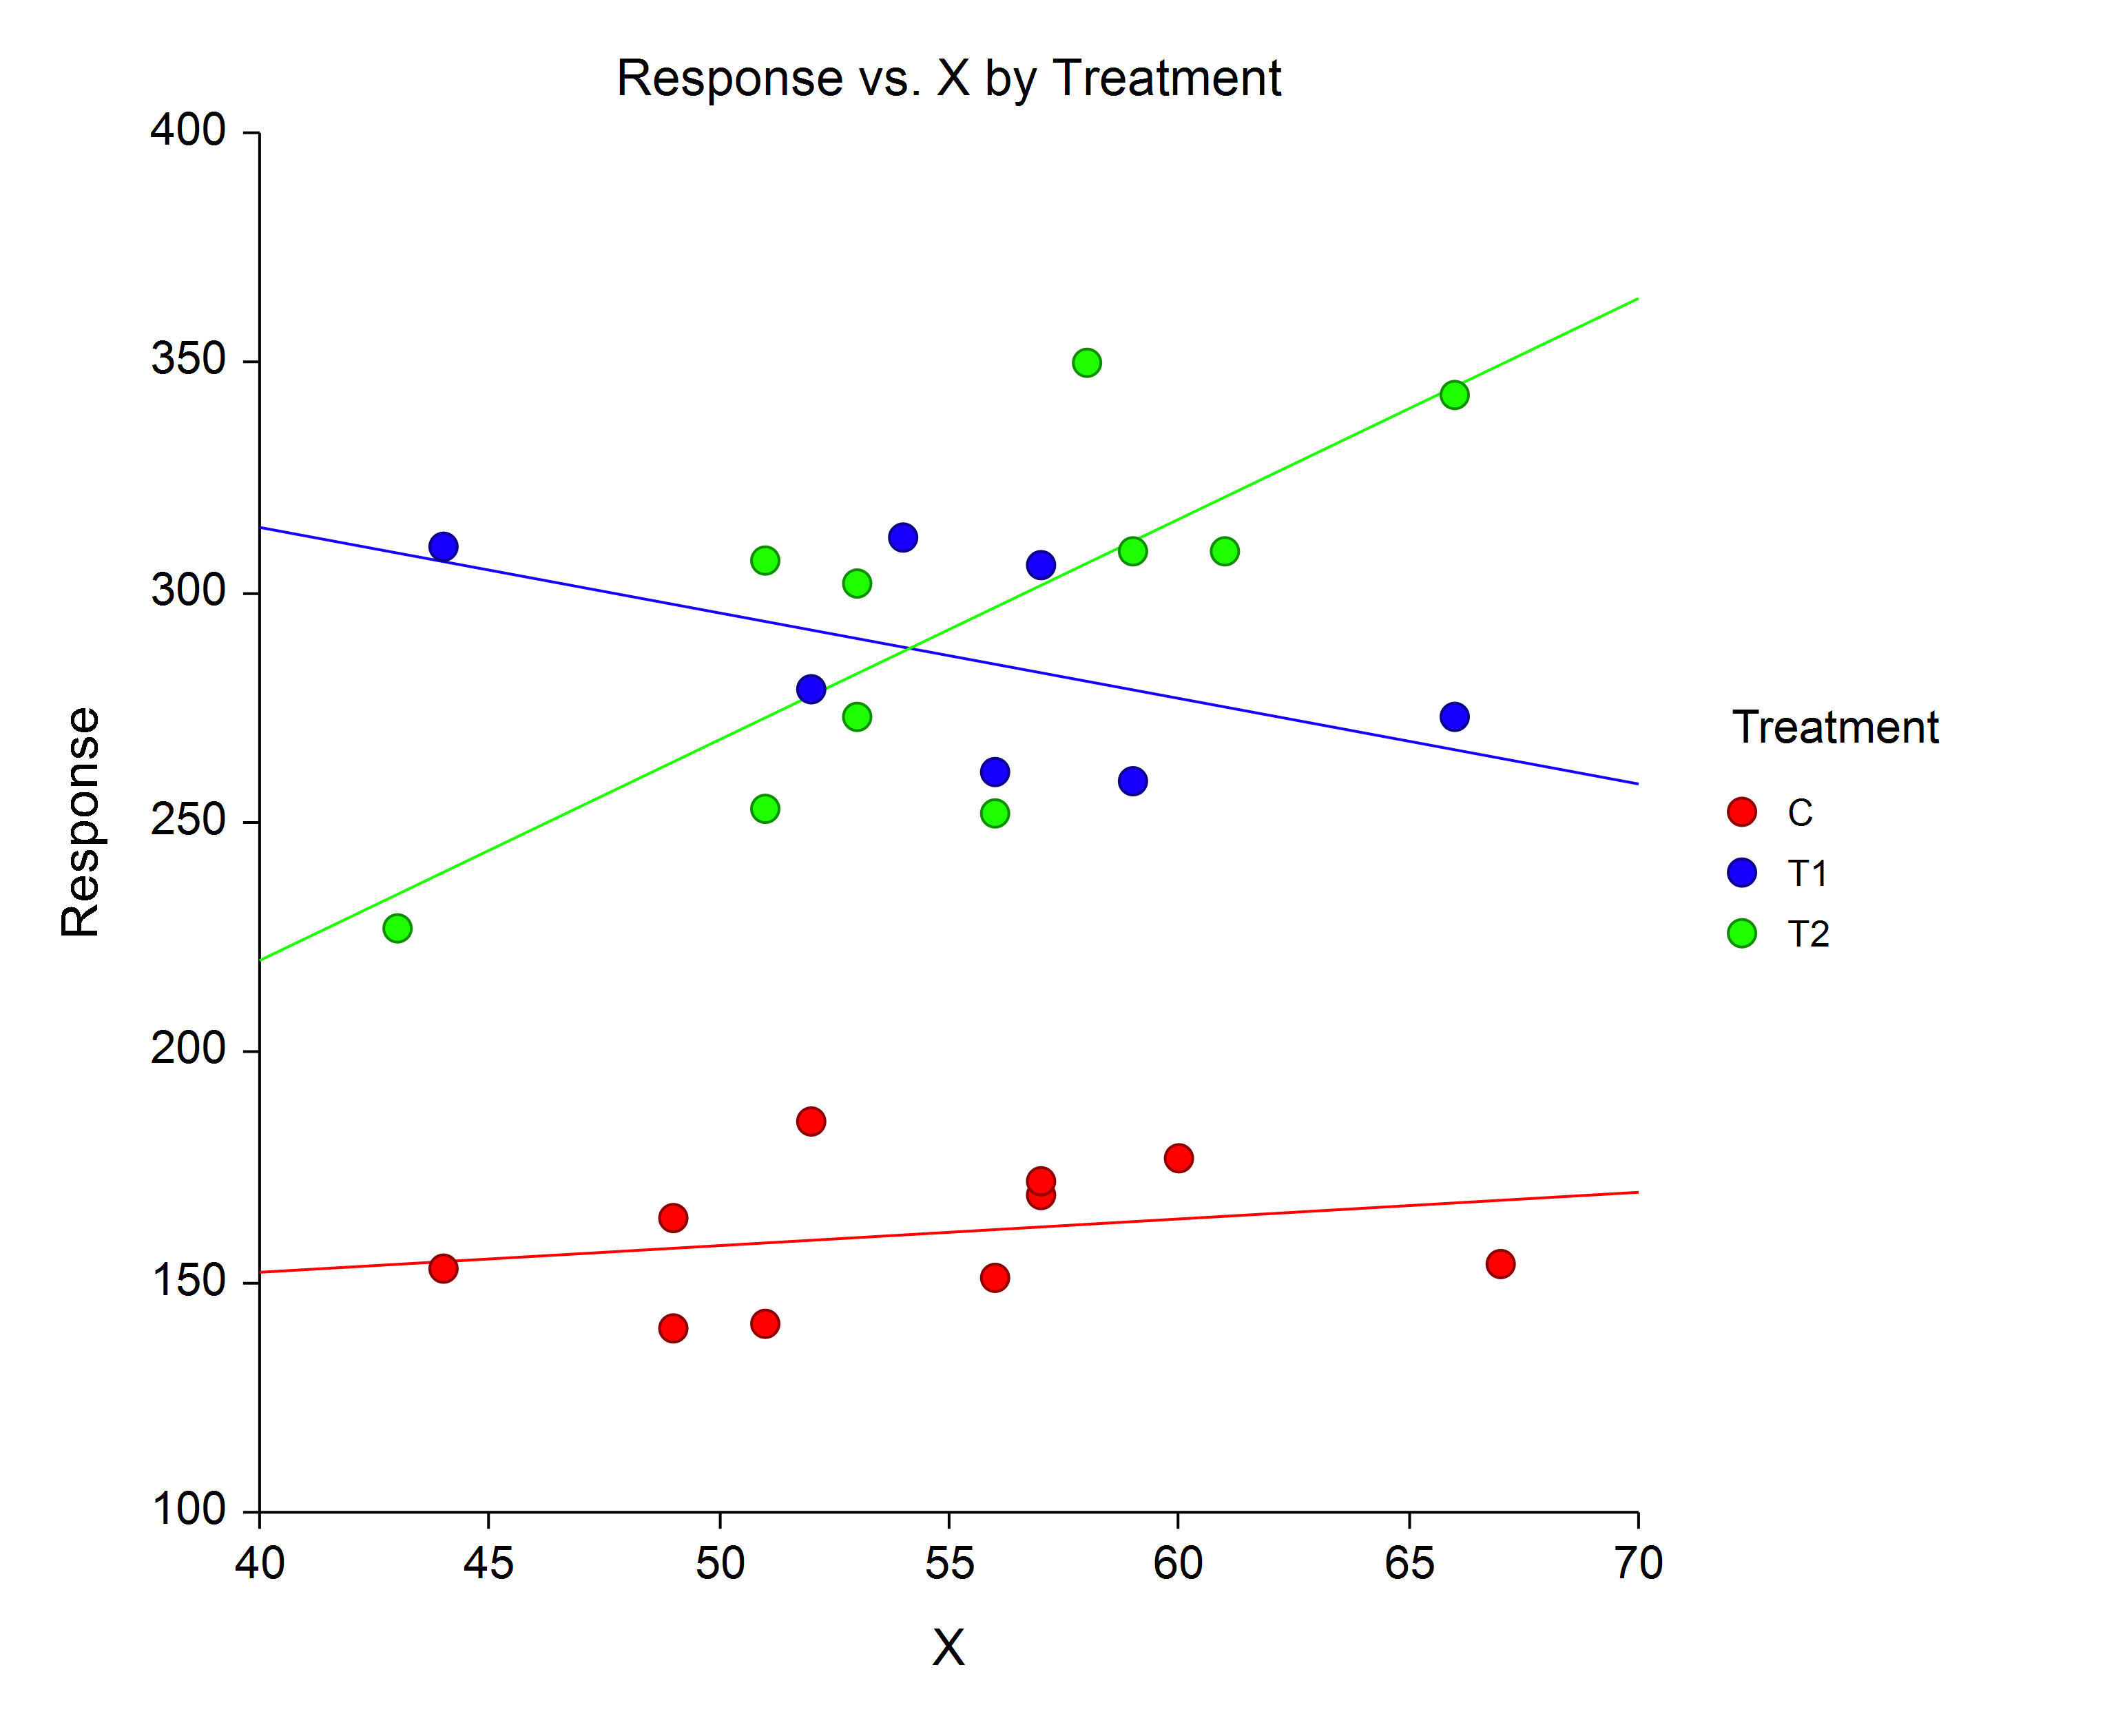
- One-Way Analysis of Covariance (ANCOVA)
- Analysis of Covariance (ANCOVA) with Two Groups
- -
- Clustered Heat Maps (Double Dendrograms)
- Clustered Heat Map (Double Dendrogram)
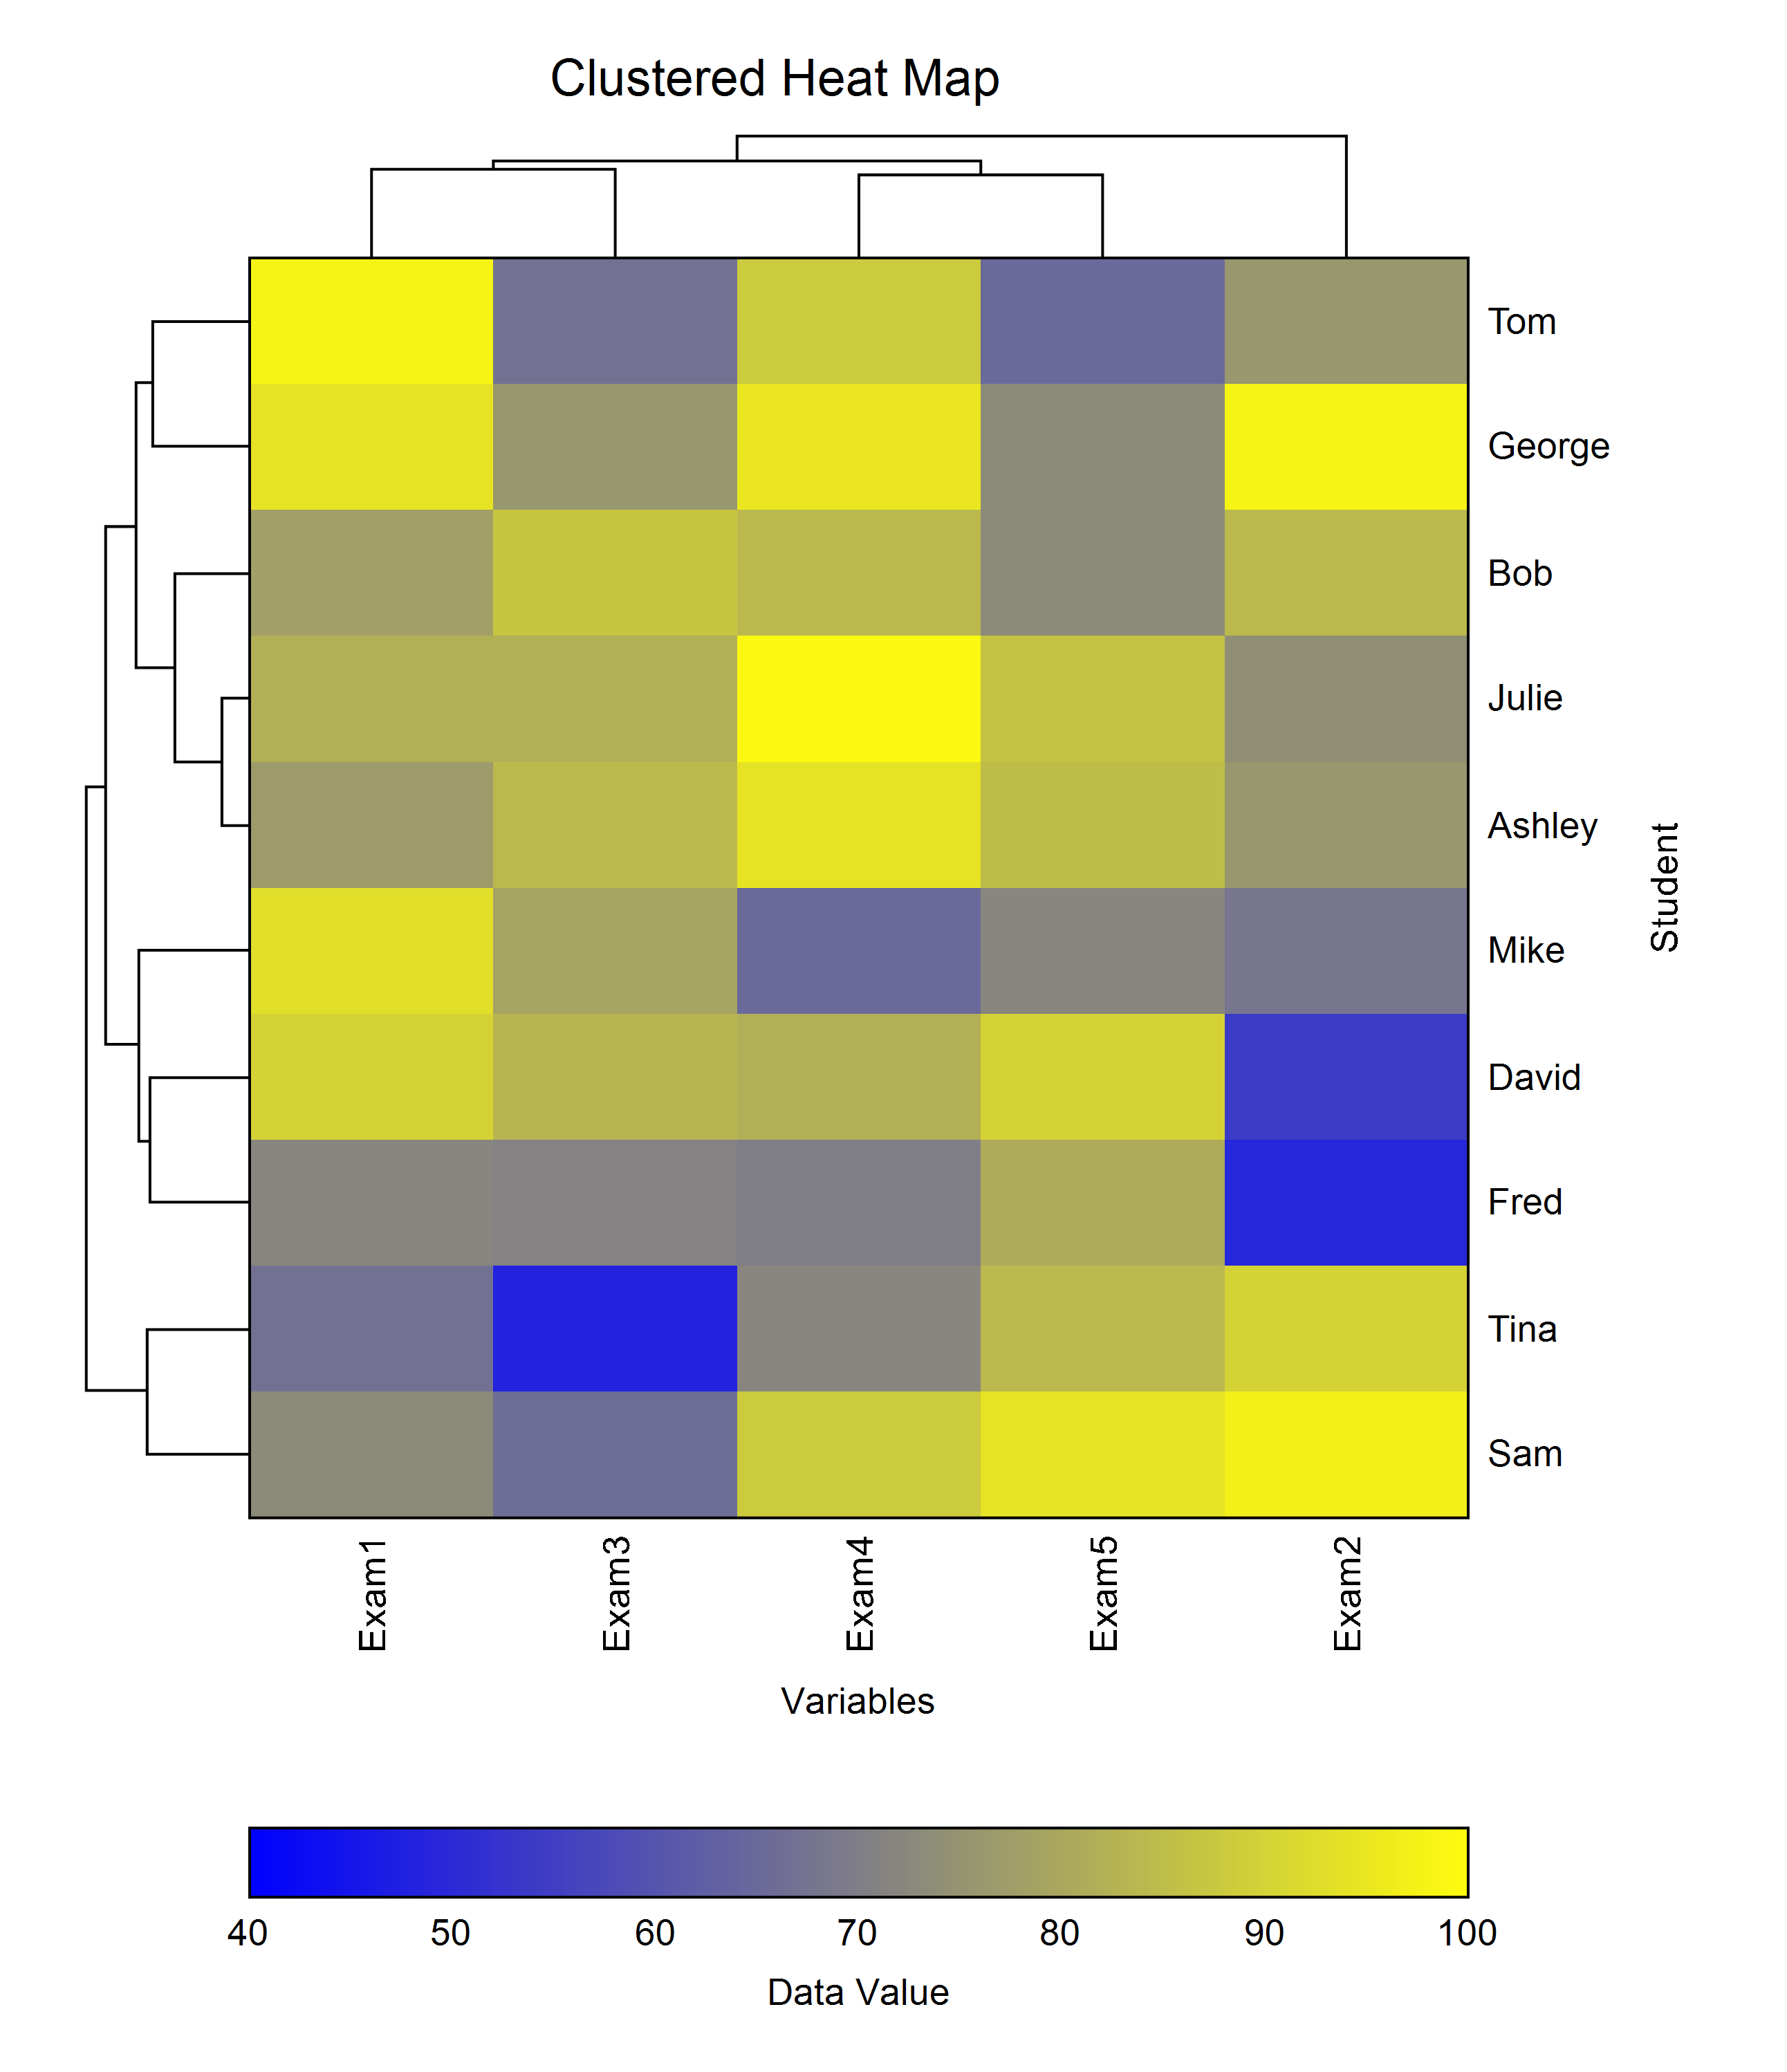
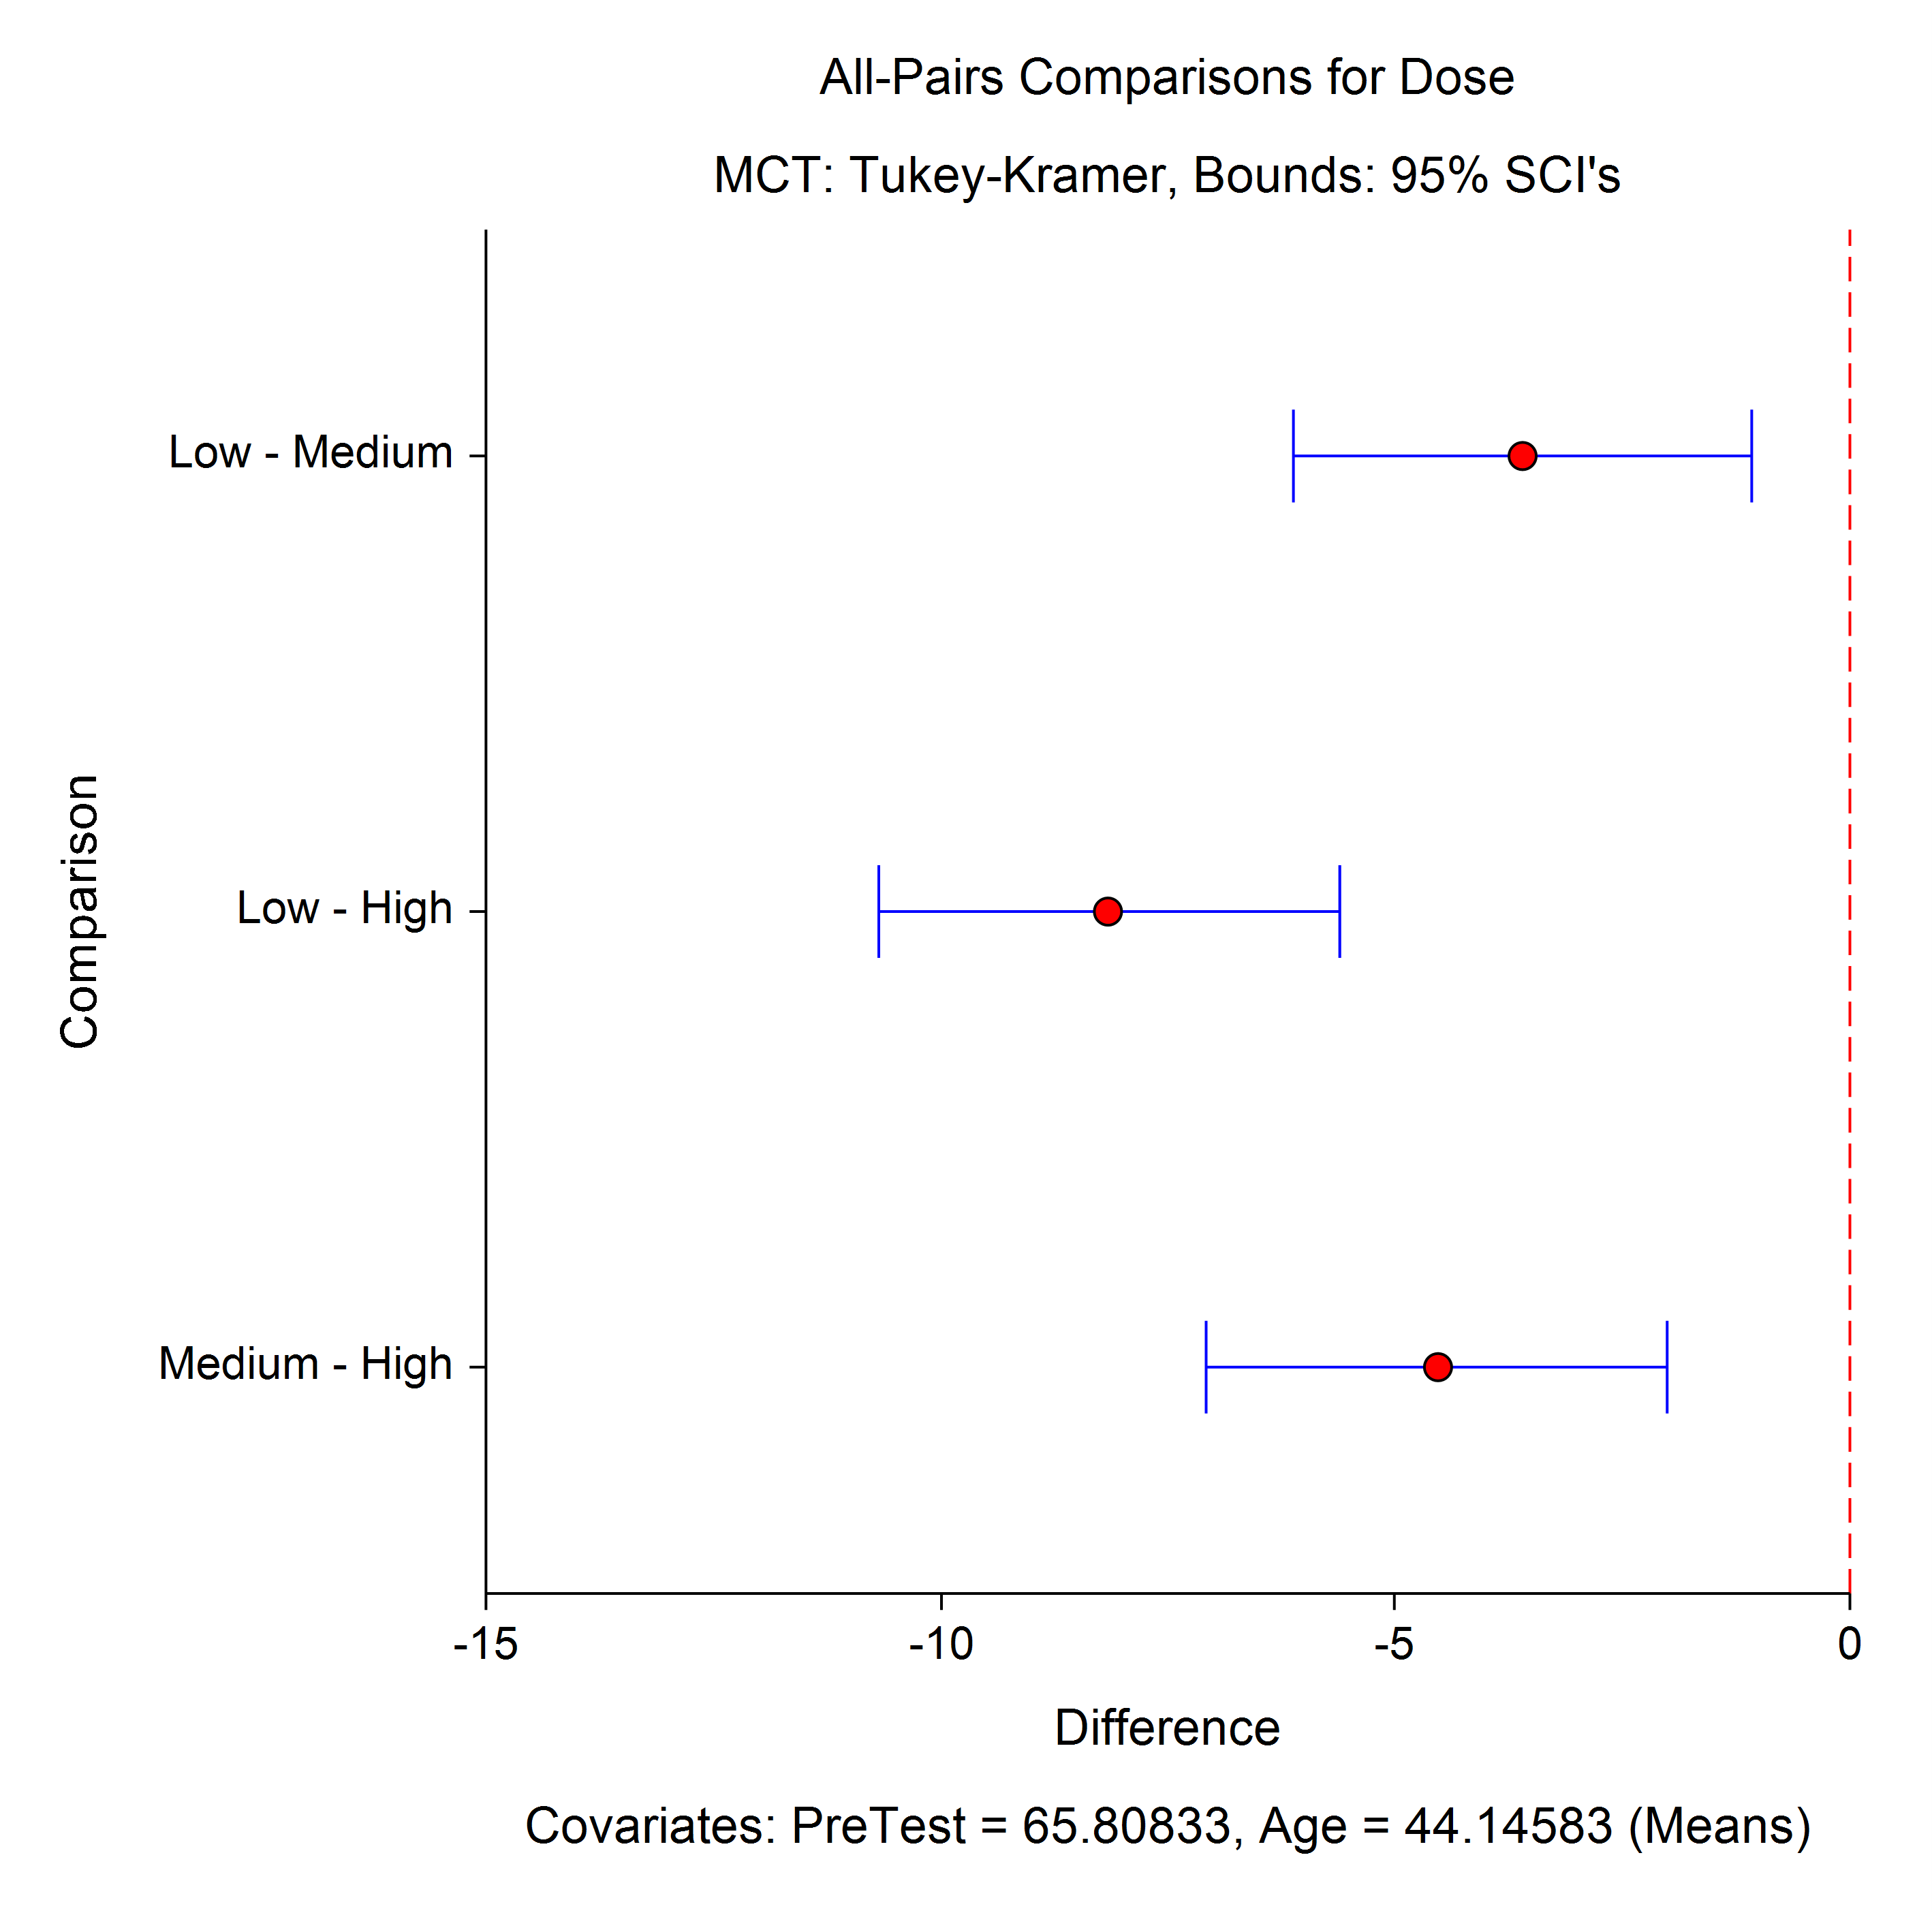
- Analysis of Covariance Plots
- Multiple Comparisons Plots
Enhancements
Spreadsheet Summary Statistics Table
A new Summary Statistics table has been added to the bottom of the spreadsheet window. This spreadsheet extension contains column summary statistics, such as number of unique values, minimum, maximum, mean, median, standard deviation, number of cells with data, and many others.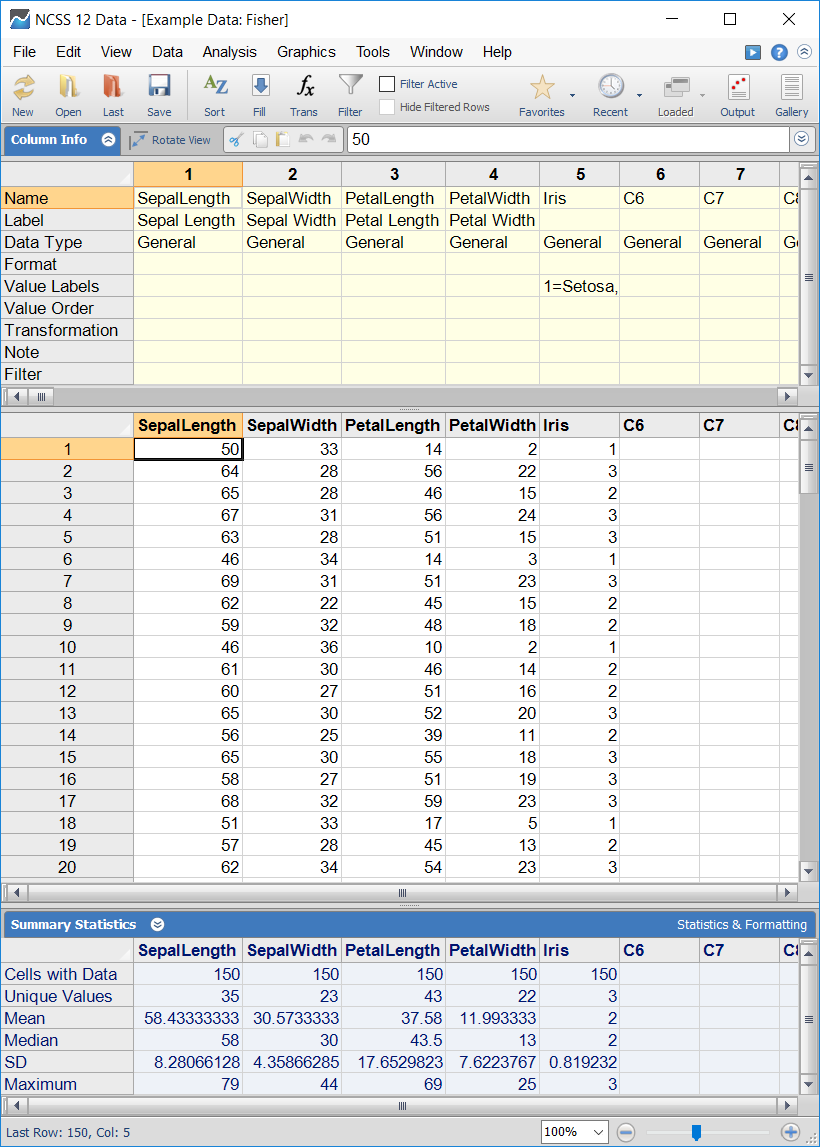
Autorecovery
A data autorecovery function was implemented.Importing Files
Imported Files are now added to the list of recent files. It is now easier to re-import files that have been imported before.Procedure Window - Recent Templates
Each procedure window now has a menu item displaying the recently opened templates. This can be used to quickly open previously used (and saved) template settings.Procedure Setting - Autosave
An option has been added to autosave the procedure settings with each run.Procedure Input Settings Report
The option to give a report in the output showing all the procedure options used has been added.Report Headers and Colors
New system options give the user the ability add (or remove) lines to the titles to improve separation of report sections. Title line color and text color for page headers, titles, and reports may also be specified individually.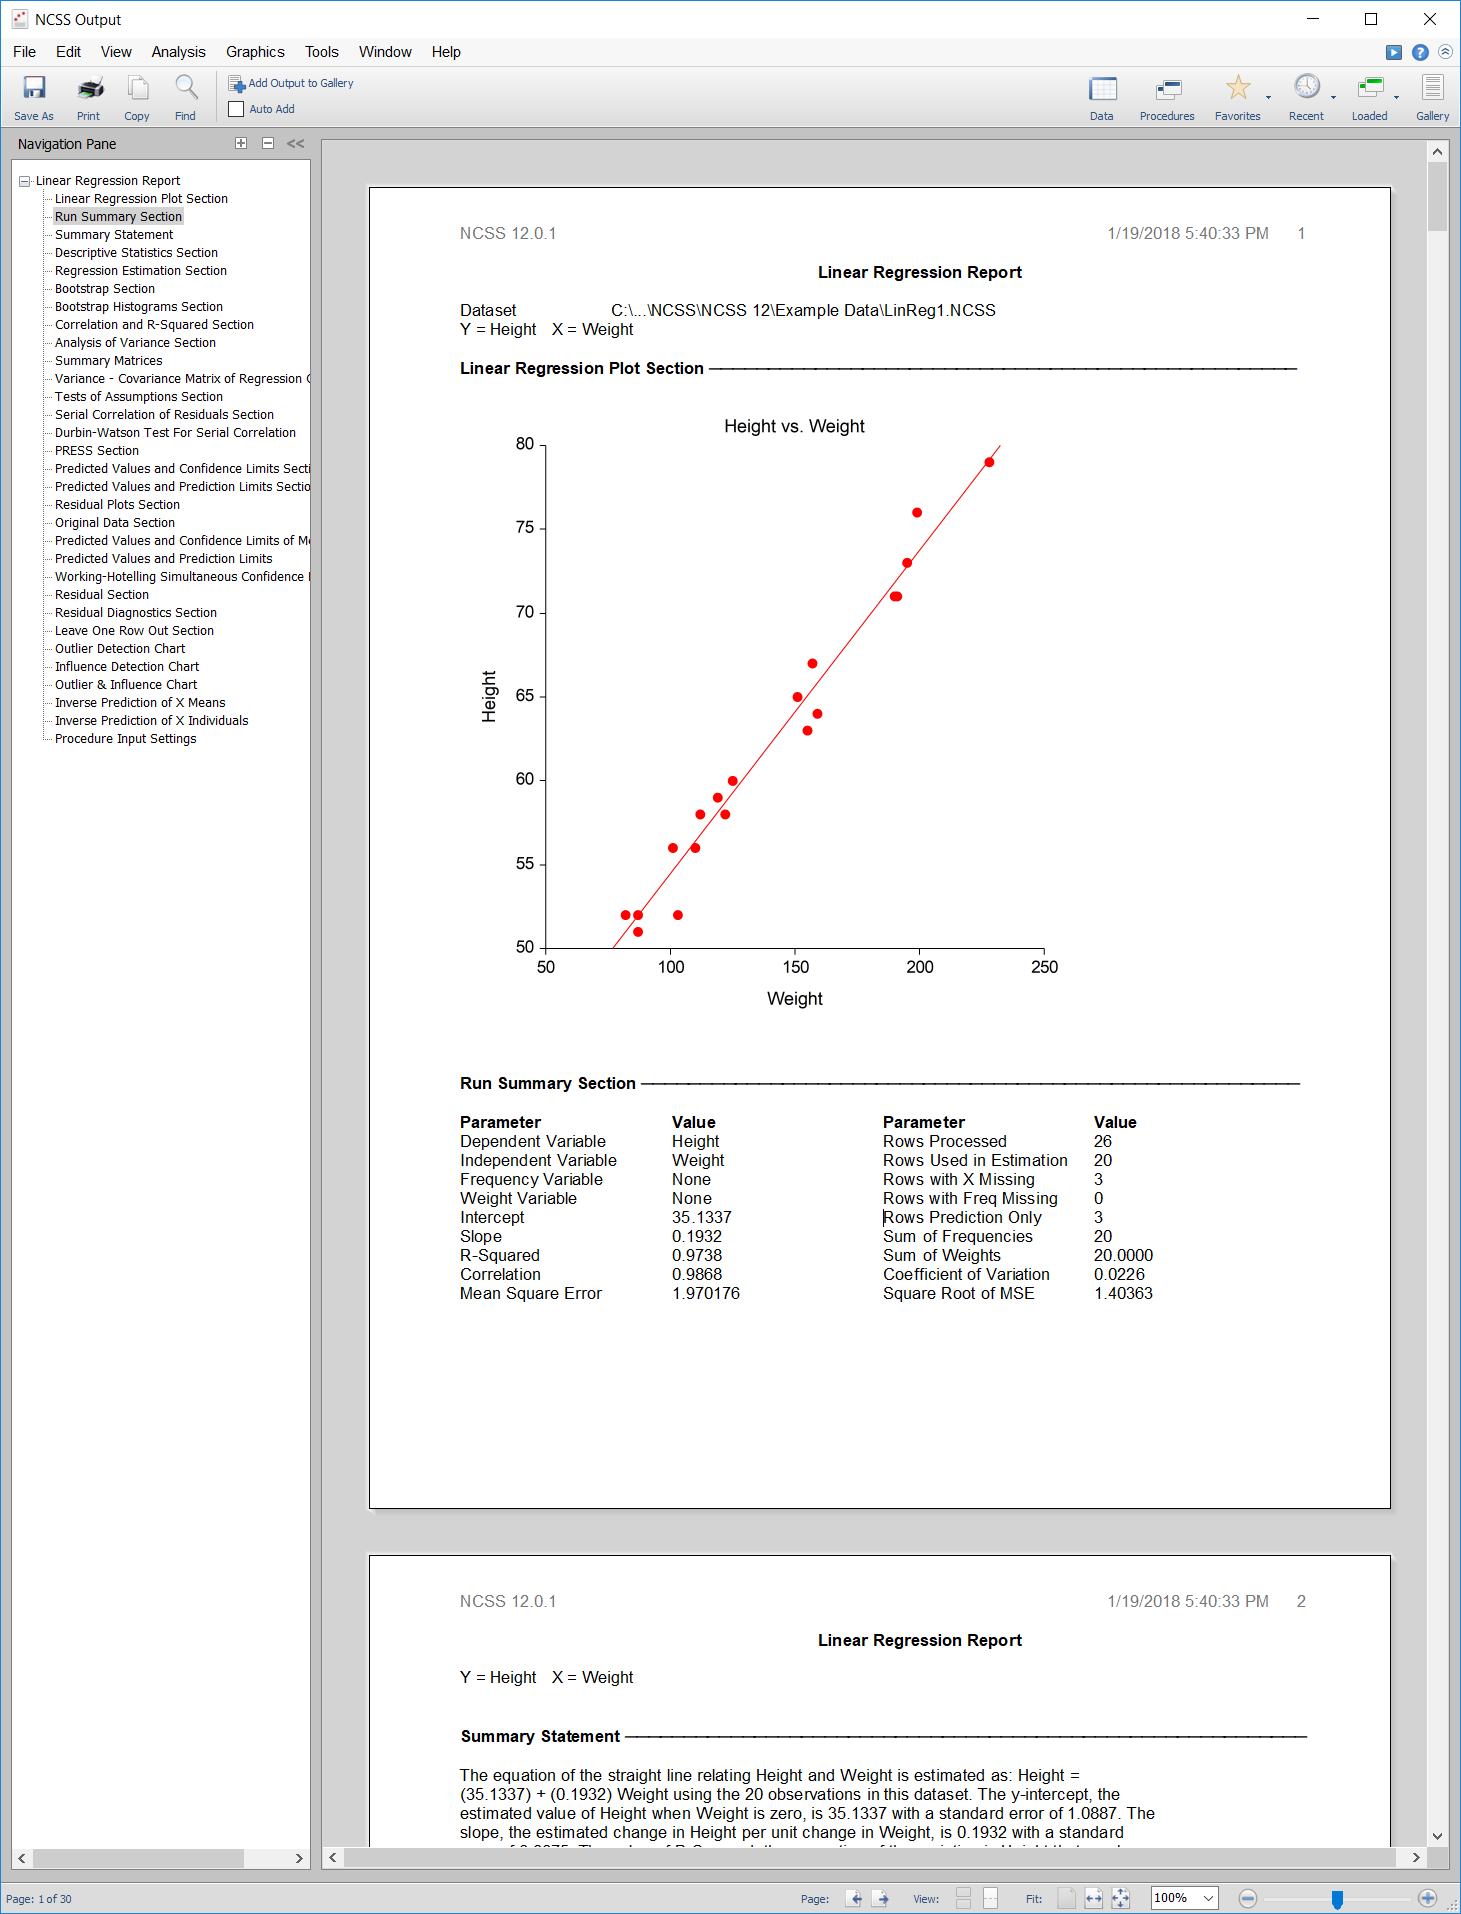
Spreadsheet Find and Replace
The find and replace functionality of the spreadsheet data table has been extended to the Column Info table and the new Summary Statistics table.Copy Table
A function giving the ability to copy the entire spreadsheet data table to the clipboard has been added.Transformations
The deviation from the mean and absolute deviation from the mean options were added to the transformation system.Paired T-Test Procedure
The Mann-Whitney U Test was improved and the Shapiro-Wilk Normality Test was added to the Paired T-Test procedure.One-Sample T-Test Procedure
The Mann-Whitney U Test was improved and the Shapiro-Wilk Normality Test was added to the One-Sample T-Test procedure.Two-Sample T-Test Procedure
The Mann-Whitney U Test was improved and the Shapiro-Wilk Normality Test was added to the Two-Sample T-Test procedure.One- and Two-Factor Box Plot
Numeric axis log scaling and the option to reverse the order of the groups or subgroups were added to the one- and two-factor box plots.Error-Bar Chart
Numeric axis log scaling and the option to reverse the order of the groups or subgroups were added to the error-bar charts.Percentile Plot
Numeric axis log scaling and the option to reverse the order of the groups or subgroups were added to the percentile plots.Comparative Histogram
Numeric axis log scaling and the option to reverse the order of the groups or subgroups were added to the comparative histograms.Density Plot
Numeric axis log scaling and the option to reverse the order of the groups or subgroups were added to the density plots.Dot Plot
Numeric axis log scaling and the option to reverse the order of the groups or subgroups were added to the dot plots.Combo Chart
Numeric axis log scaling and the option to reverse the order of the groups or subgroups were added to the combo charts.Bar Chart
The option to reverse the order of the groups or subgroups was added to the bar charts.2x2 Cross-over Analysis using T-Tests Procedure
A numeric test for Normality and the Mann-Whitney U Non-parametric test were added to the 2x2 Cross-over Analysis using T-Tests procedure.Fractional Polynomial Regression Procedure - Predicted Values and Residuals
The ability to store predicted values and residuals to the spreadsheet from a fractional polynomial regression run has been added.Reference Interval Procedure - Predicted Values and Residuals
The ability to store predicted values and residuals to the spreadsheet from a Reference Interval - Age-Specific procedure run has been added.Procedures and Enhancements added in the NCSS 11 Upgrade from NCSS 10
A wide range of new procedures, plots, and enhancements were added in the upgrade from NCSS 10 to NCSS 11.Procedures Added in NCSS 11
- Conditional Logistic Regression
- Multiple Regression - Basic
- Negative Binomial Regression
- Zero-Inflated Negative Binomial Regression
- Zero-Inflated Poisson Regression
- Geometric Regression
- Fractional Polynomial Regression
- Passing-Bablok Regression for Method Comparison
- Robust Linear Regression (Passing-Bablok Median-Slope)
- Logistic Regression (including confidence intervals for AUC)
- Two-Stage Least Squares
- -
- Scatter Plots with Error Bars
- Scatter Plots with Error Bars from Summary Data
- Error-Bar Charts from Summary Data
- Error-Bar Charts from Summary Data (2 Factors)
- -
- Descriptive Statistics - Summary Tables
- Descriptive Statistics - Summary Lists
- -
- One ROC Curve and Cutoff Analysis
- Comparing Two ROC Curves - Independent Groups Design
- Comparing Two ROC Curves - Paired Design
- Single Sample Binary Diagnostic Test Analysis
- -
- Correlation
- Circular Data Correlation
- -
- Reference Intervals
- -
- Appraisal Ratio Studies
- Comparables Appraisal
- Hybrid Appraisal Models
- Multiple Regression for Appraisal
- -
- Acceptance Sampling for Attributes
- Operating Characteristic Curves for Acceptance Sampling for Attributes
- -
- Linear Programming with Bounds
- Mixed Integer Programming
- Quadratic Programming
- Transportation
- Assignment
- Minimum Spanning Tree
- Shortest Route
- Maximum Flow
- Minimum Cost Capacitated Flow
- Transshipment
- -
- Dwass-Steel-Critchlow-Fligner MC Test (in the One-Way Analysis of Variance Procedure)
- Scatter Plot with Error Bars

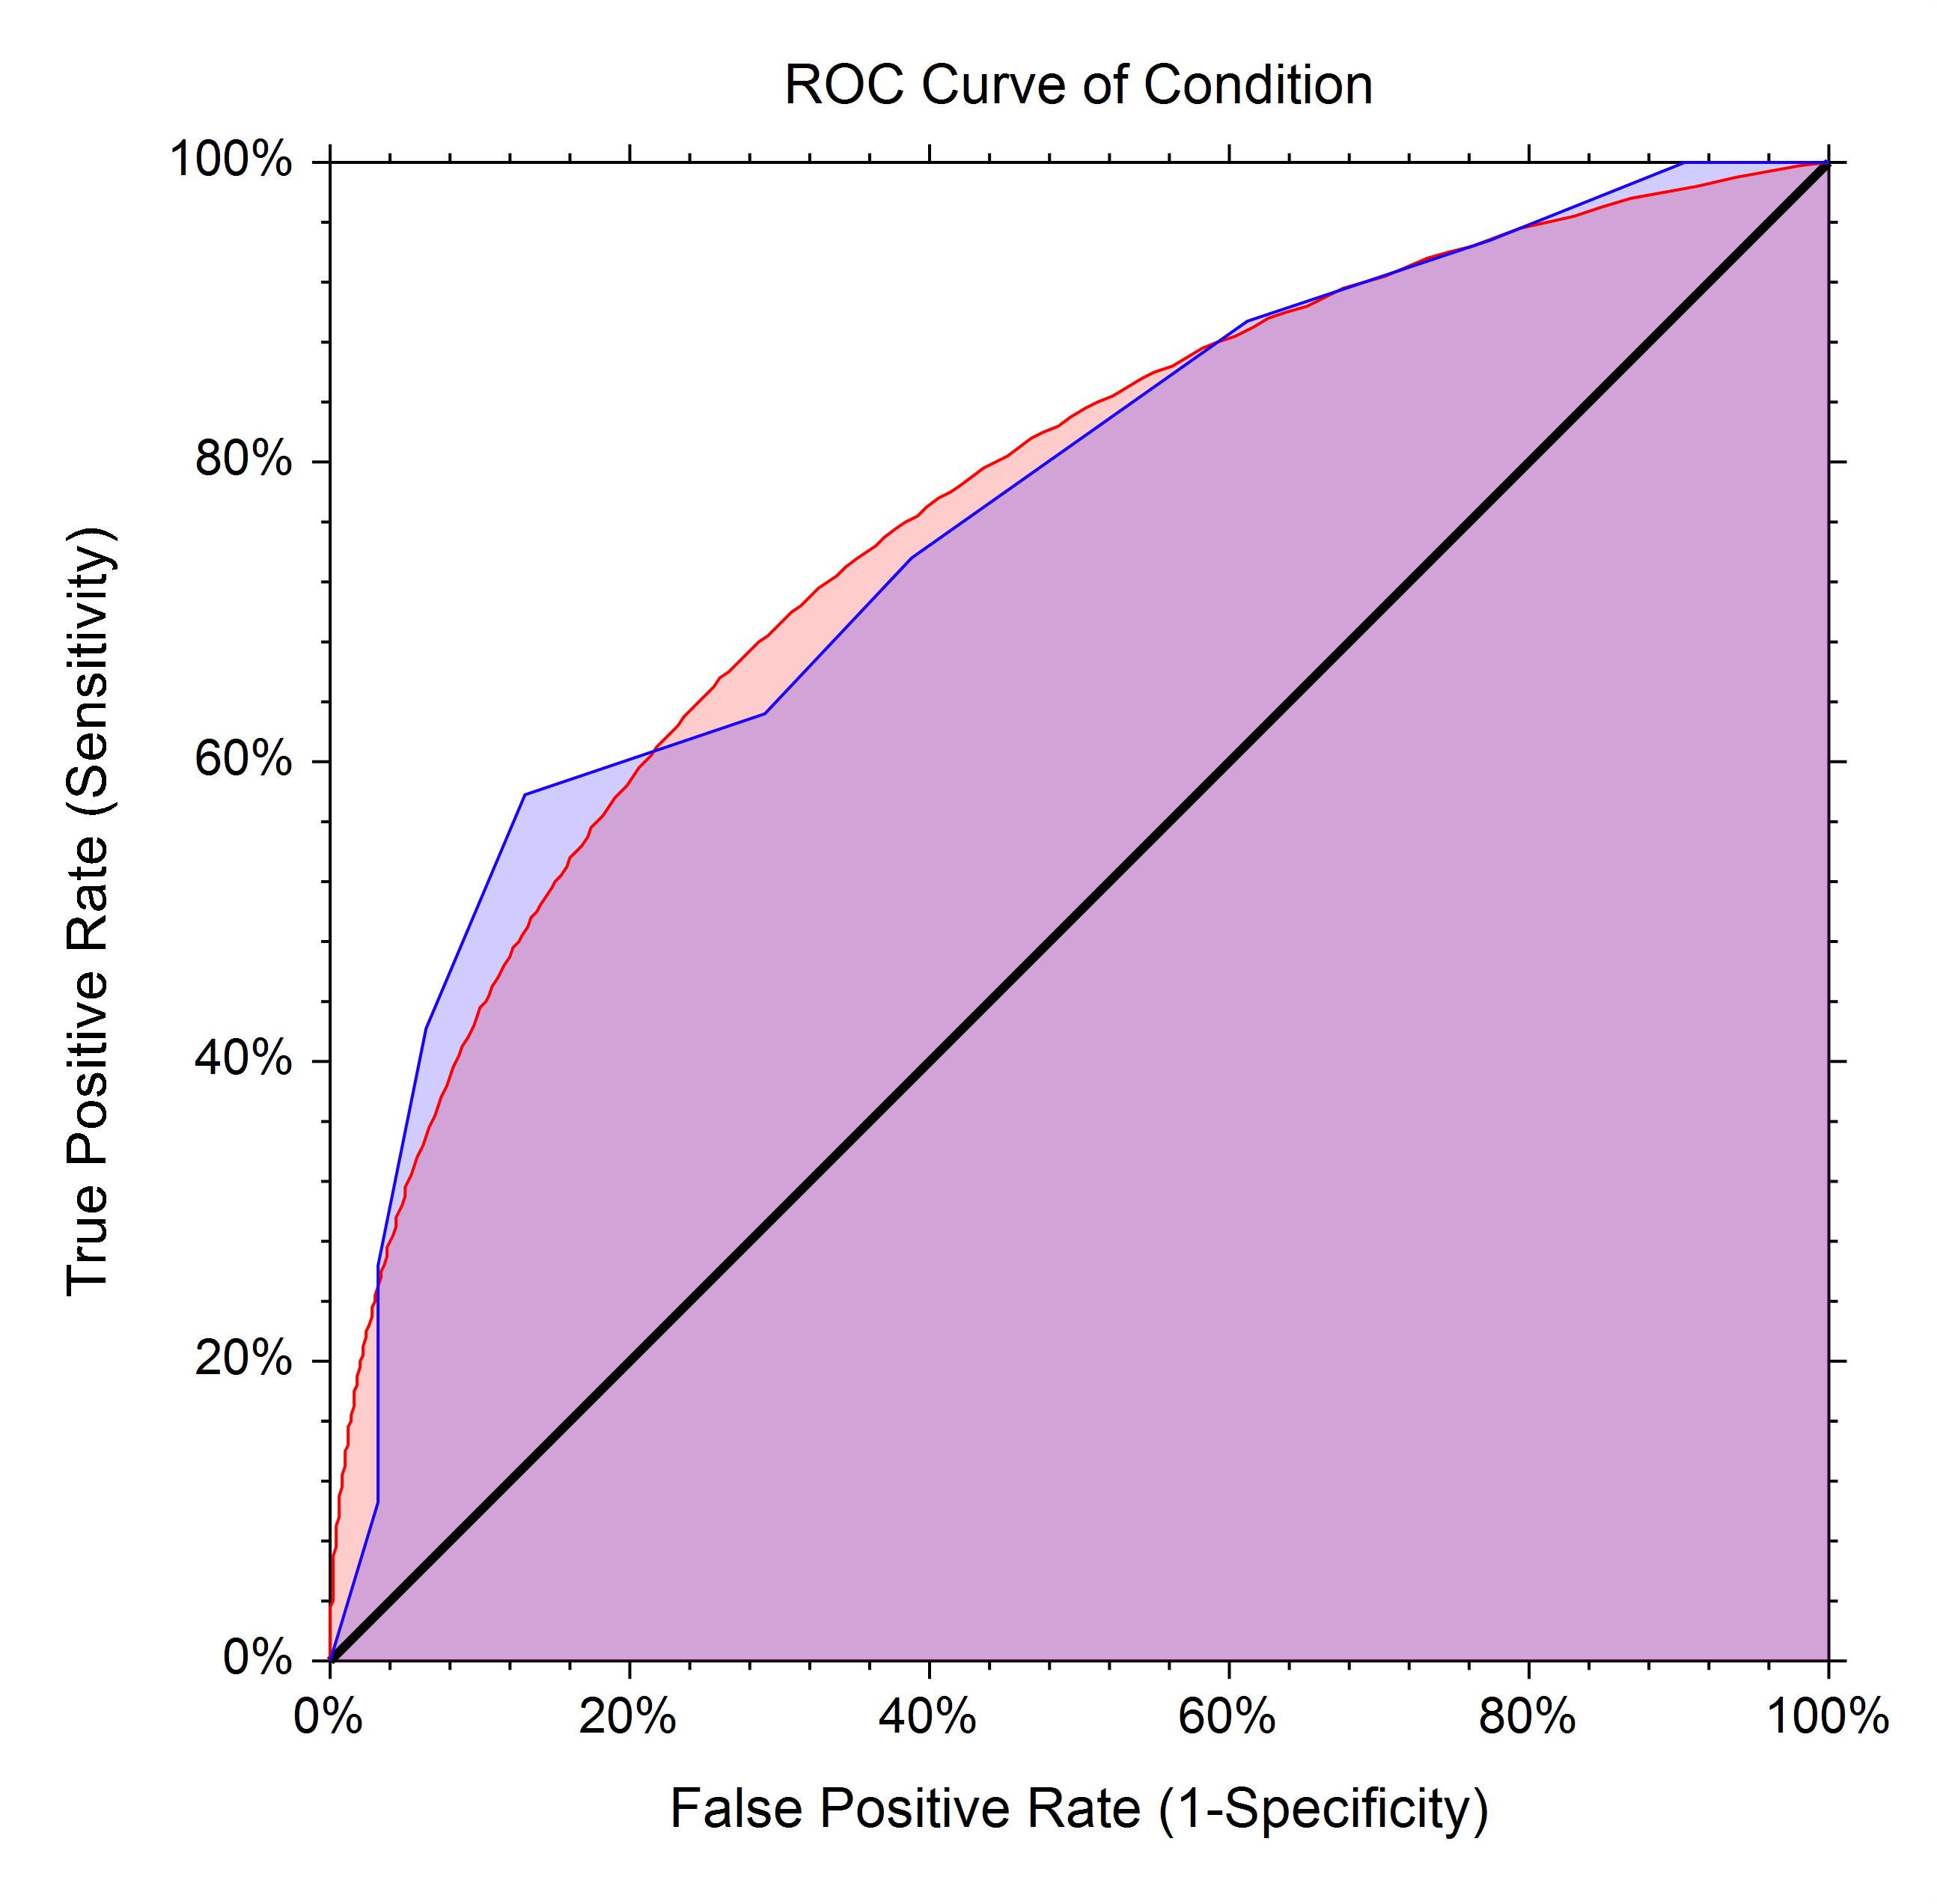
- ROC Curves
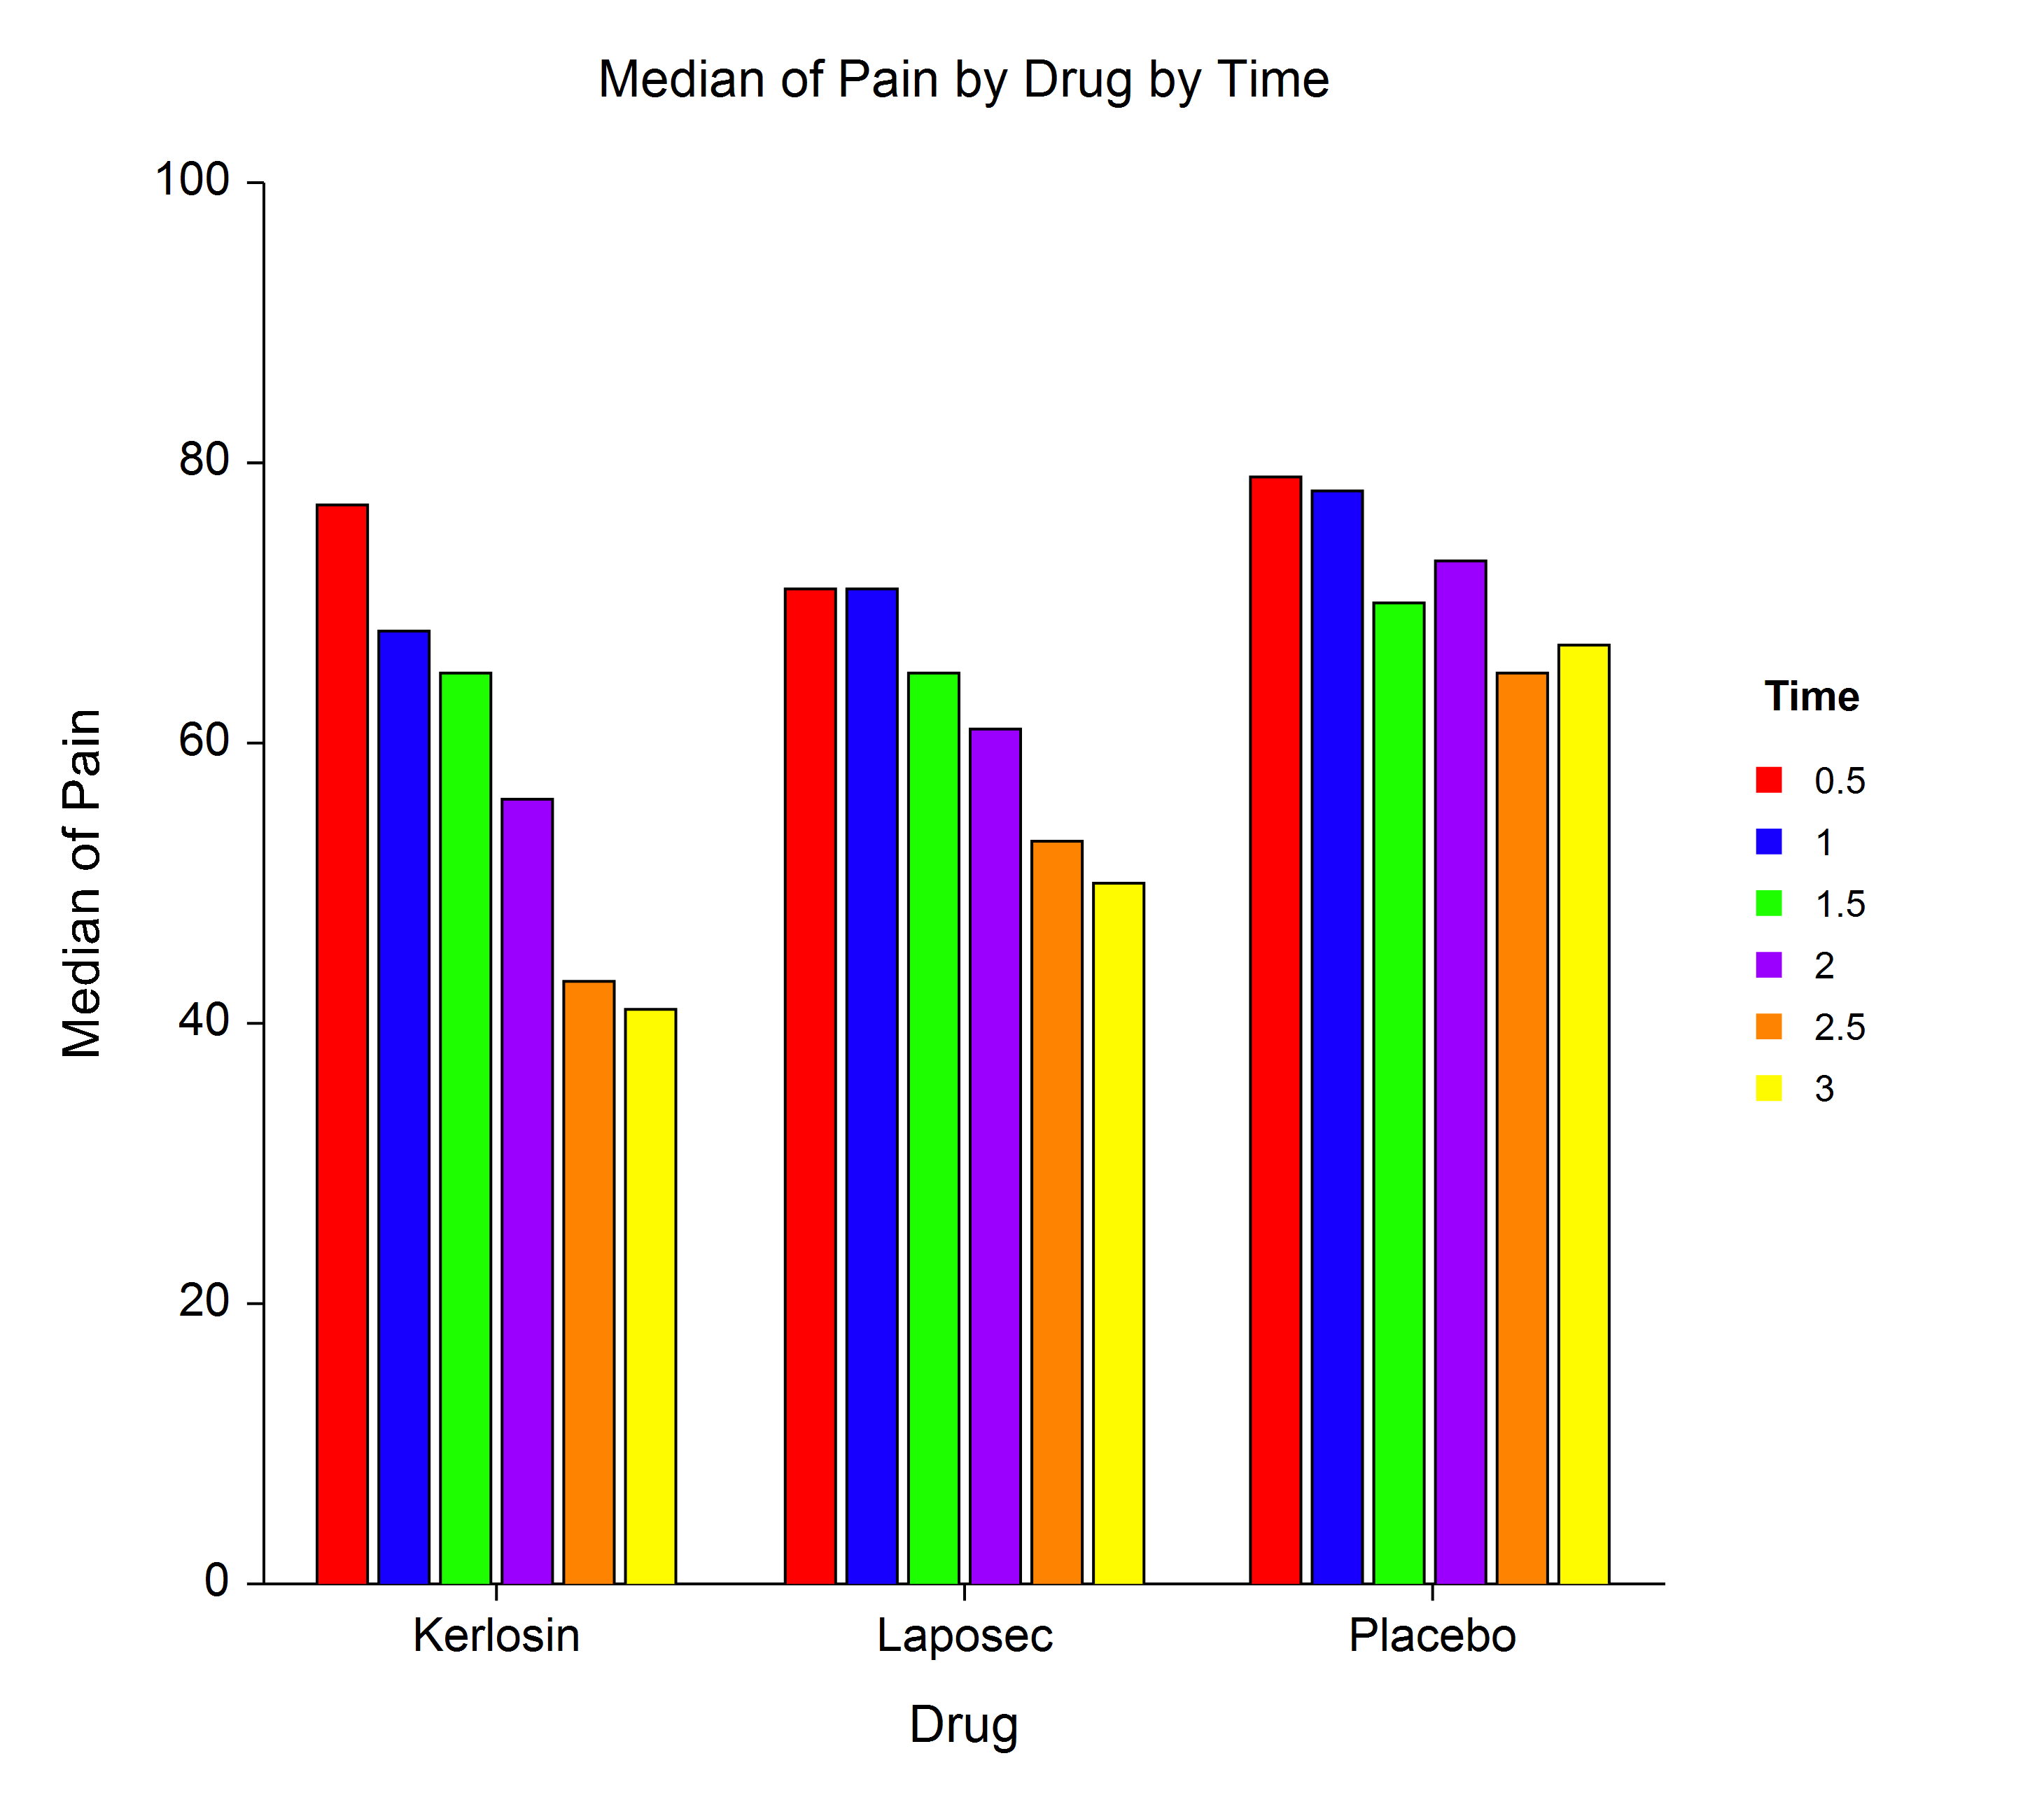
- Summary Table Plots
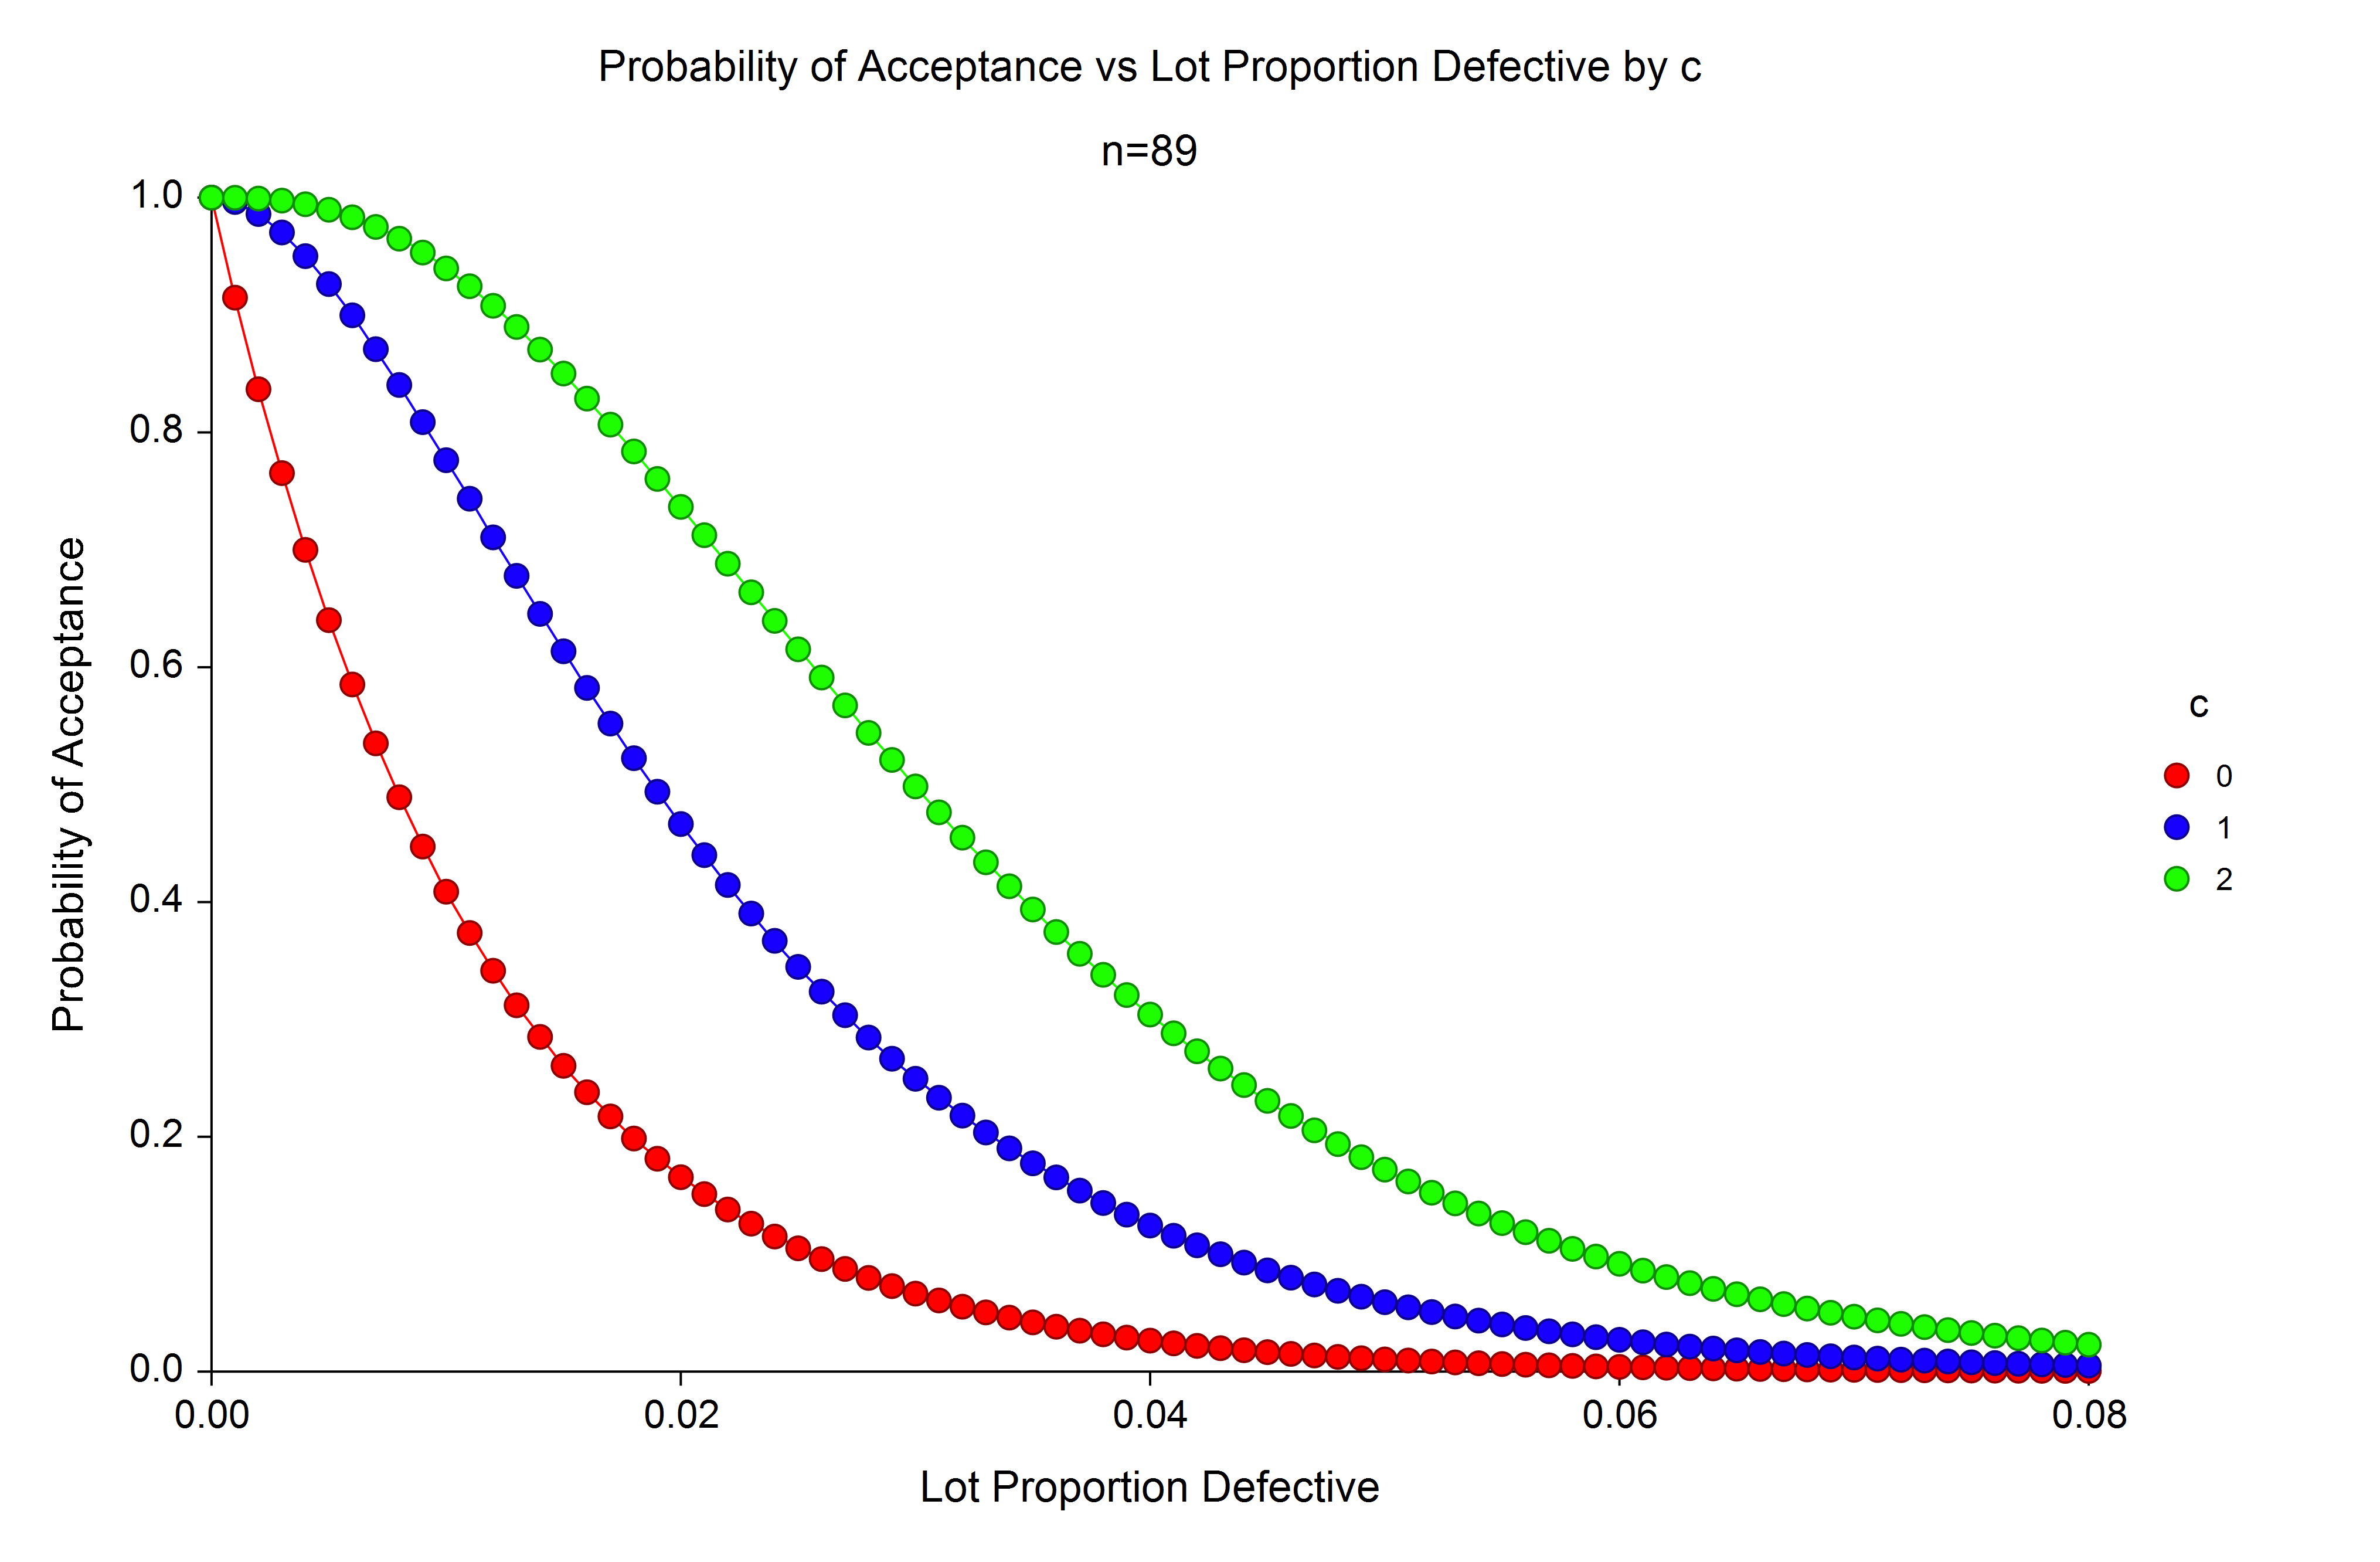
- Operating Characteristic Curves for Acceptance Sampling for Attributes
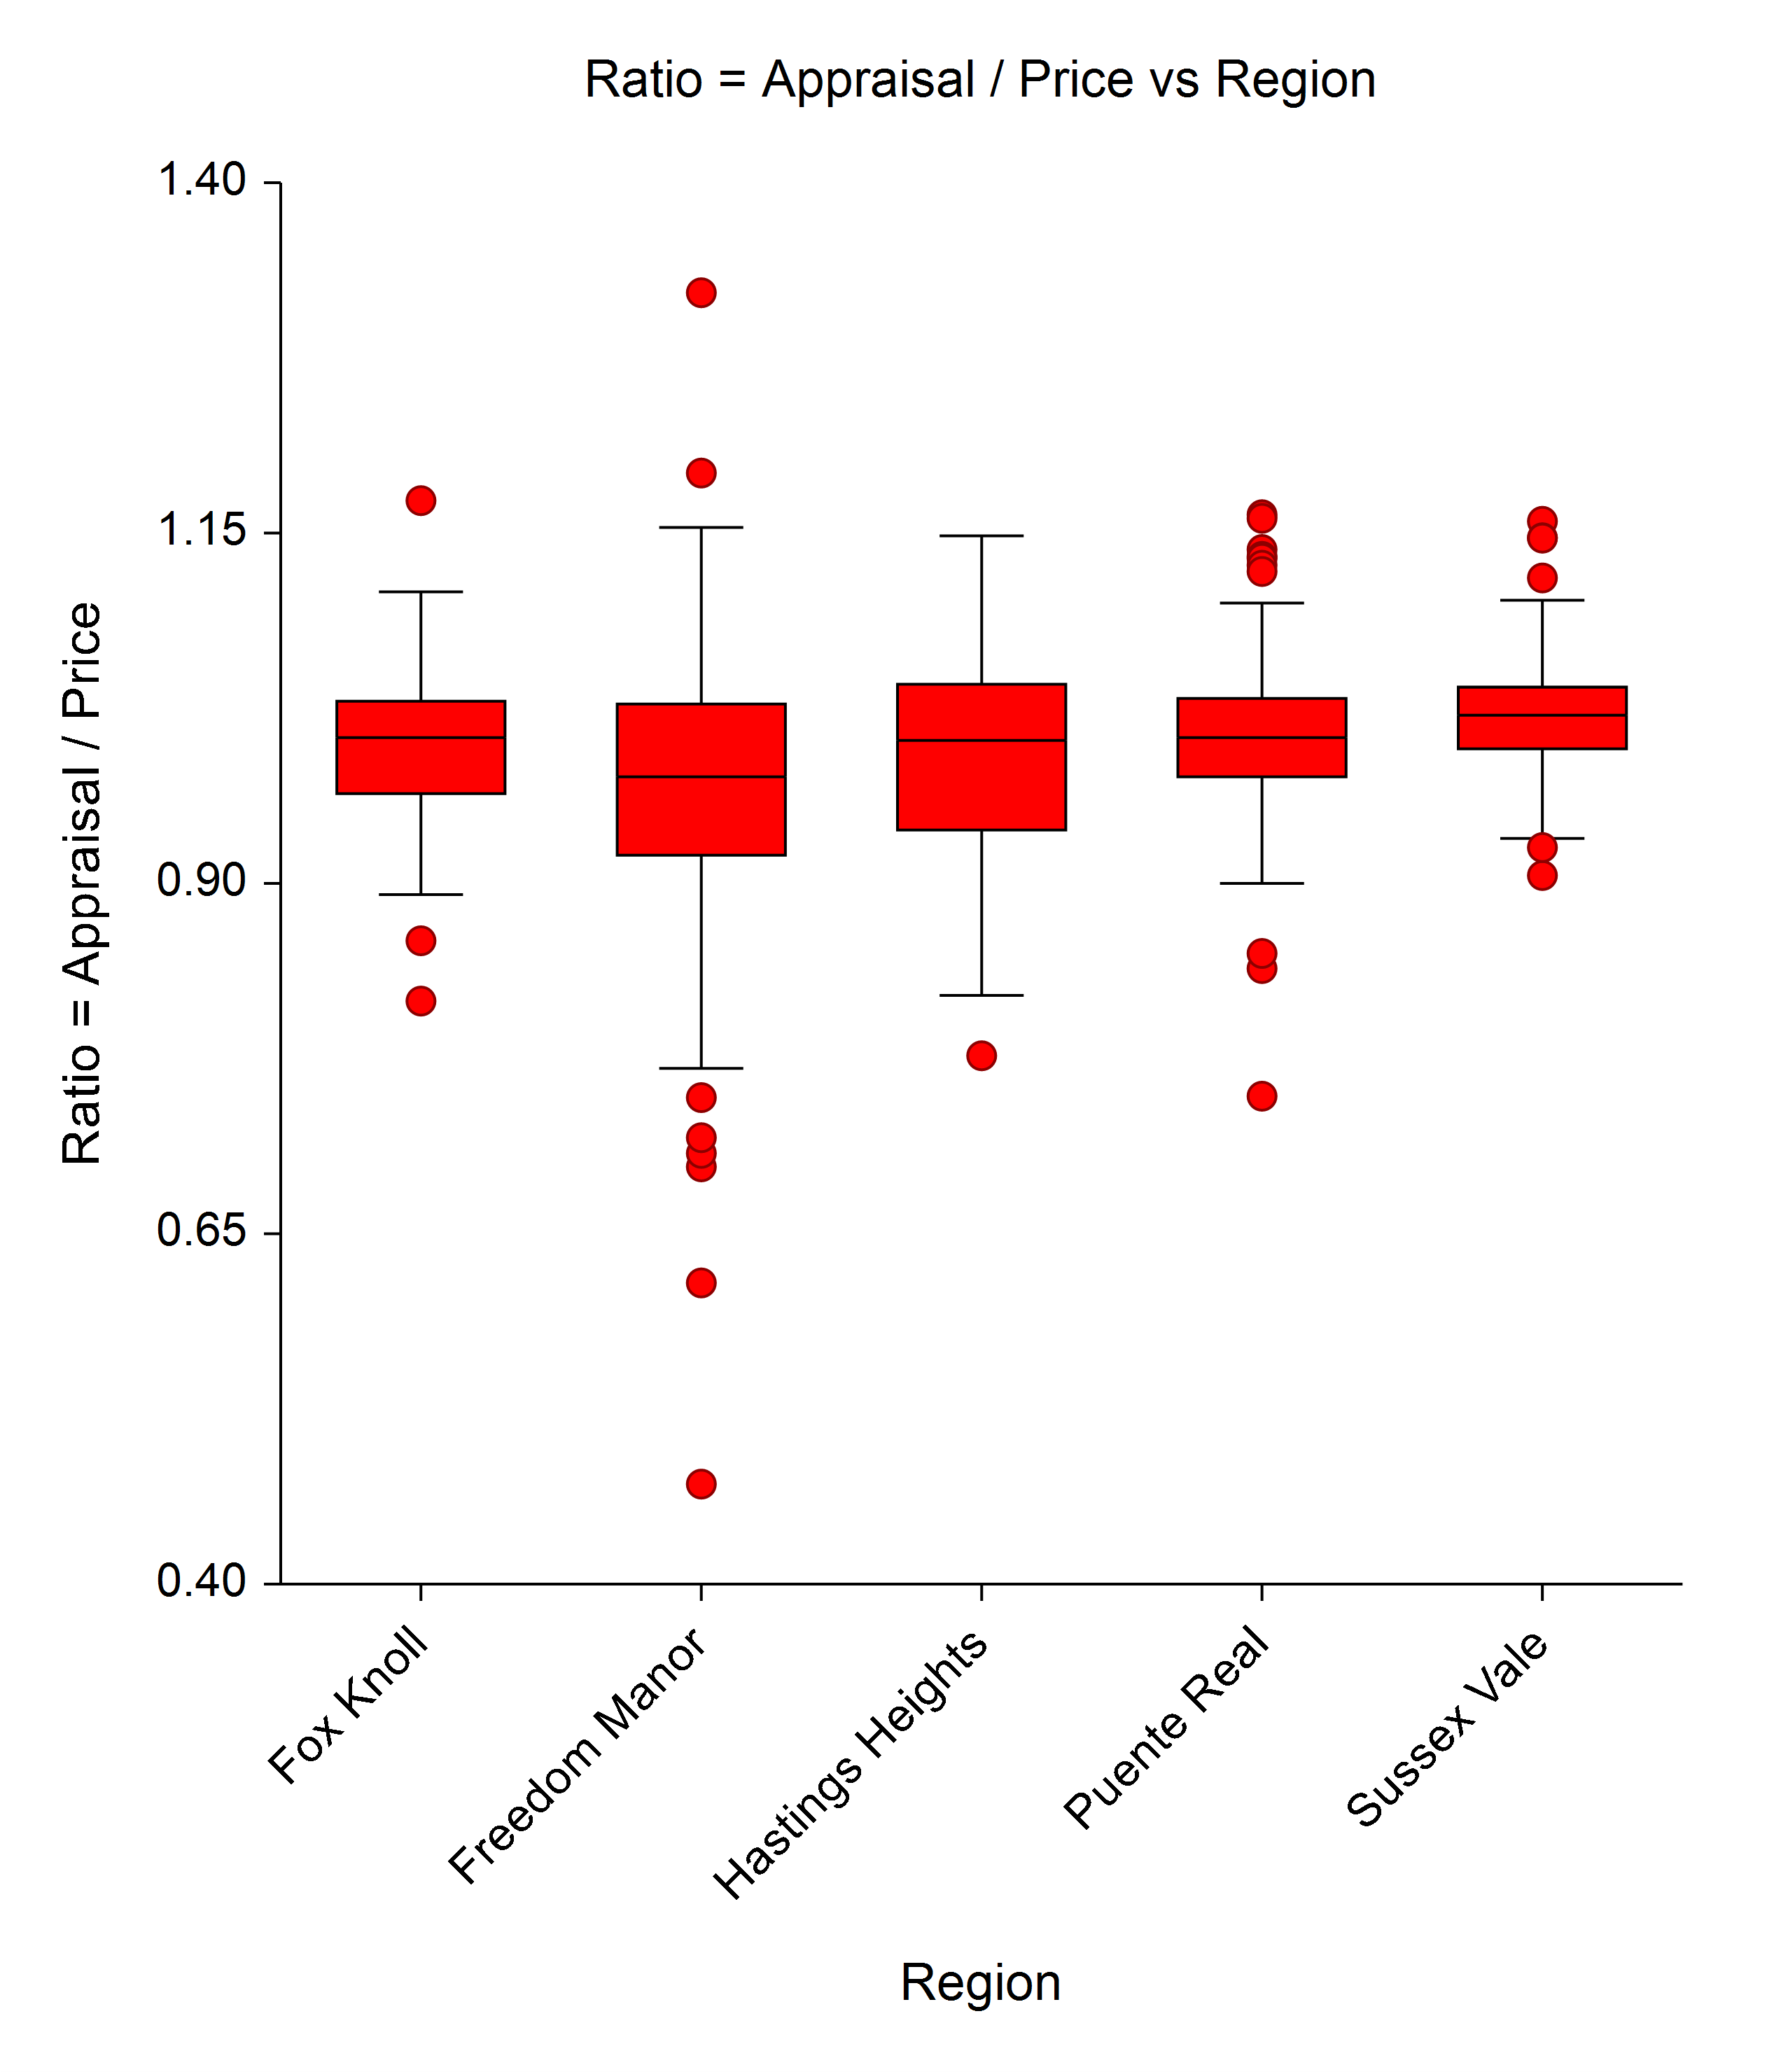
- Appraisal Ratio Horizontal Equity Plot
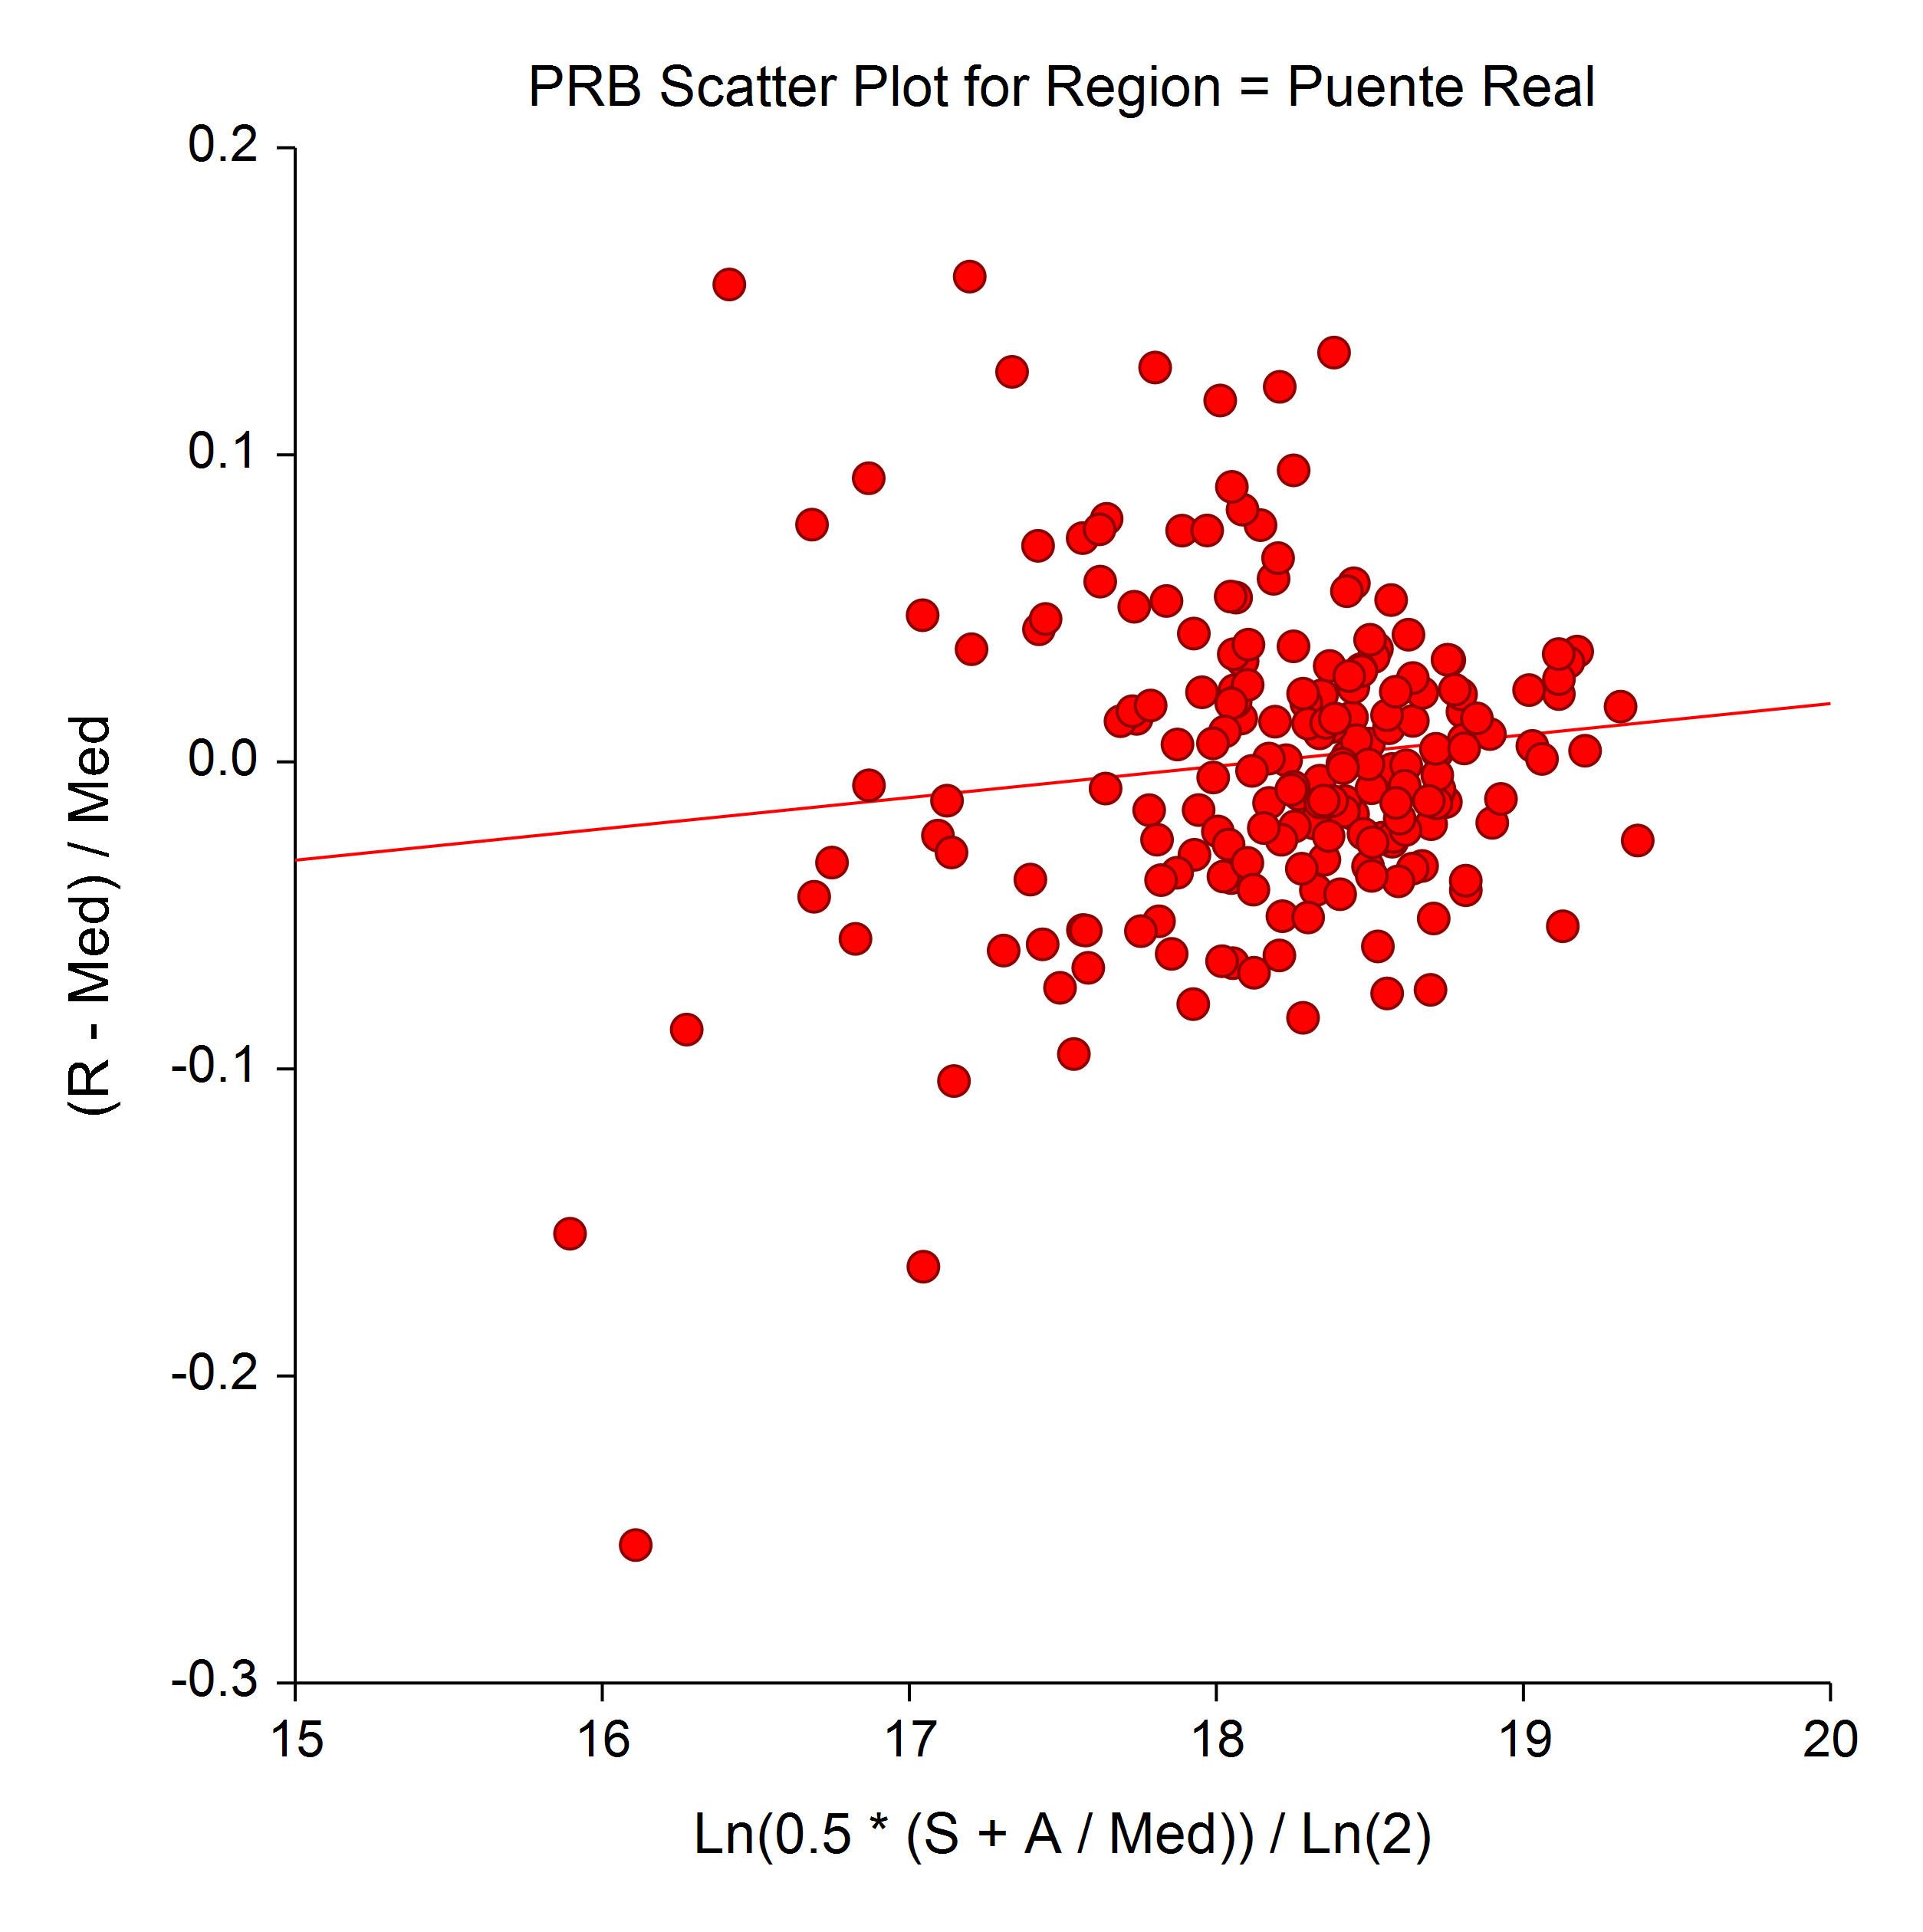
- Appraisal Ratio Price-Related Bias Scatter Plot
Enhancements
Data Simulation Procedure
The Data Simulation procedure was enhanced to include a much larger selection of distributions.One-Way ANOVA Residuals
The One-Way Analysis of Variance procedure now gives the ability to store residuals.Contingency Tables Table Entry
The table entry in the Contingency Tables (Crosstabs / Chi-Square Test) procedure was improved.One Proportion Data Entry
A Database Data Entry option is now available in the One Proportion procedure.Export Tool
The Export tool now has the ability to select variables for export.Output Titles
Software version titles are given in the output.Error-Bar Plots
The error-bar plots procedures now give the options for Confidence Interval and Range.Spreadsheet Controls
The Spreadsheet controls have been updated.3D Charting
The 3D charting control has been updated for additional processing and display speed.Column Selection Tools
The column selection tools have been dramatically enhanced.Auto-Scaling of Ticks
The Auto-Scaling of the ticks of the numeric axis of plots has been improved.Filters and Missing Values in Time Series and Forecasting
Filter and missing values options are now available in all Forecasting and Time Series procedures.Procedure Menus
The procedure menus were enhanced to be more intuitive.Features and Procedures added in the NCSS 10 Upgrade from NCSS 9
The upgrade from NCSS 9 to NCSS 10 contained a very large number of new procedures, plots, and features.New Procedures
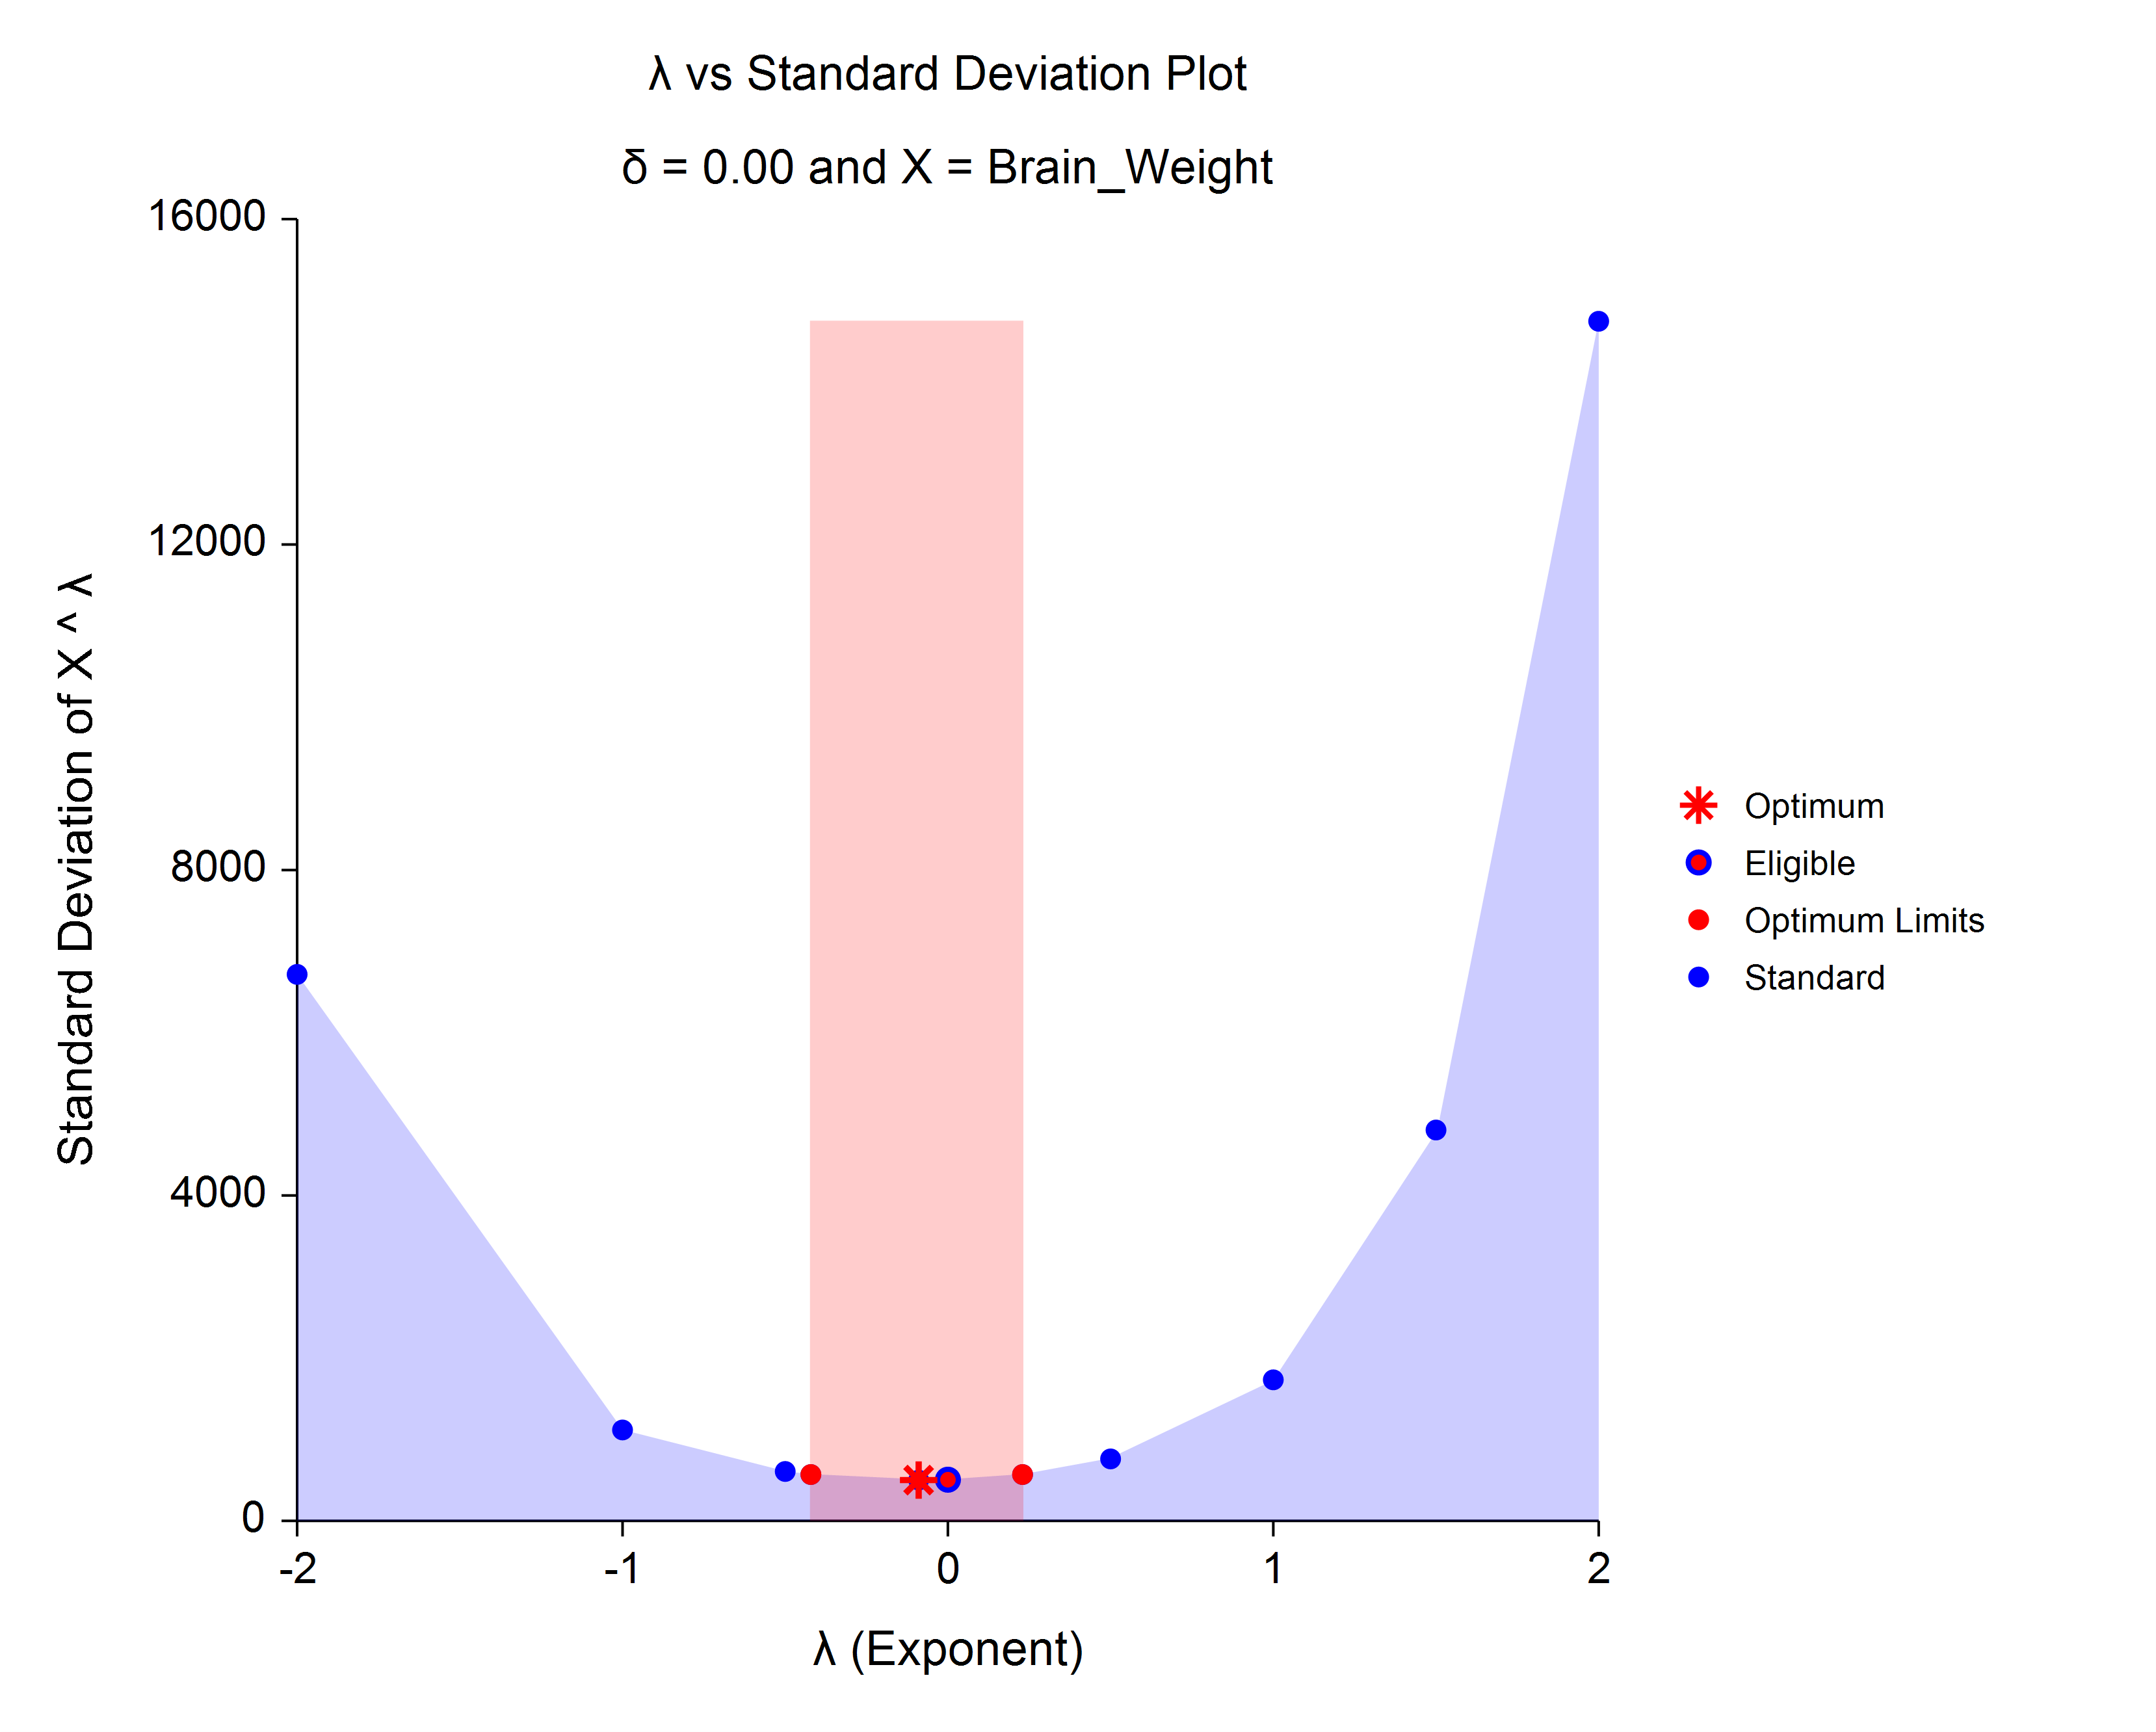
Addition of new procedures and tests:- Box-Cox Transformation
- Box-Cox Transformation for Two or More Groups (T-Test and One-Way ANOVA)
- Box-Cox Transformation for Simple Linear Regression
- Point-Biserial and Biserial Correlations
- Cochran's Q Test with Multiple Comparisons
- Michaelis-Menten Equation
- Bland-Altman Plot and Analysis
- Deming Regression
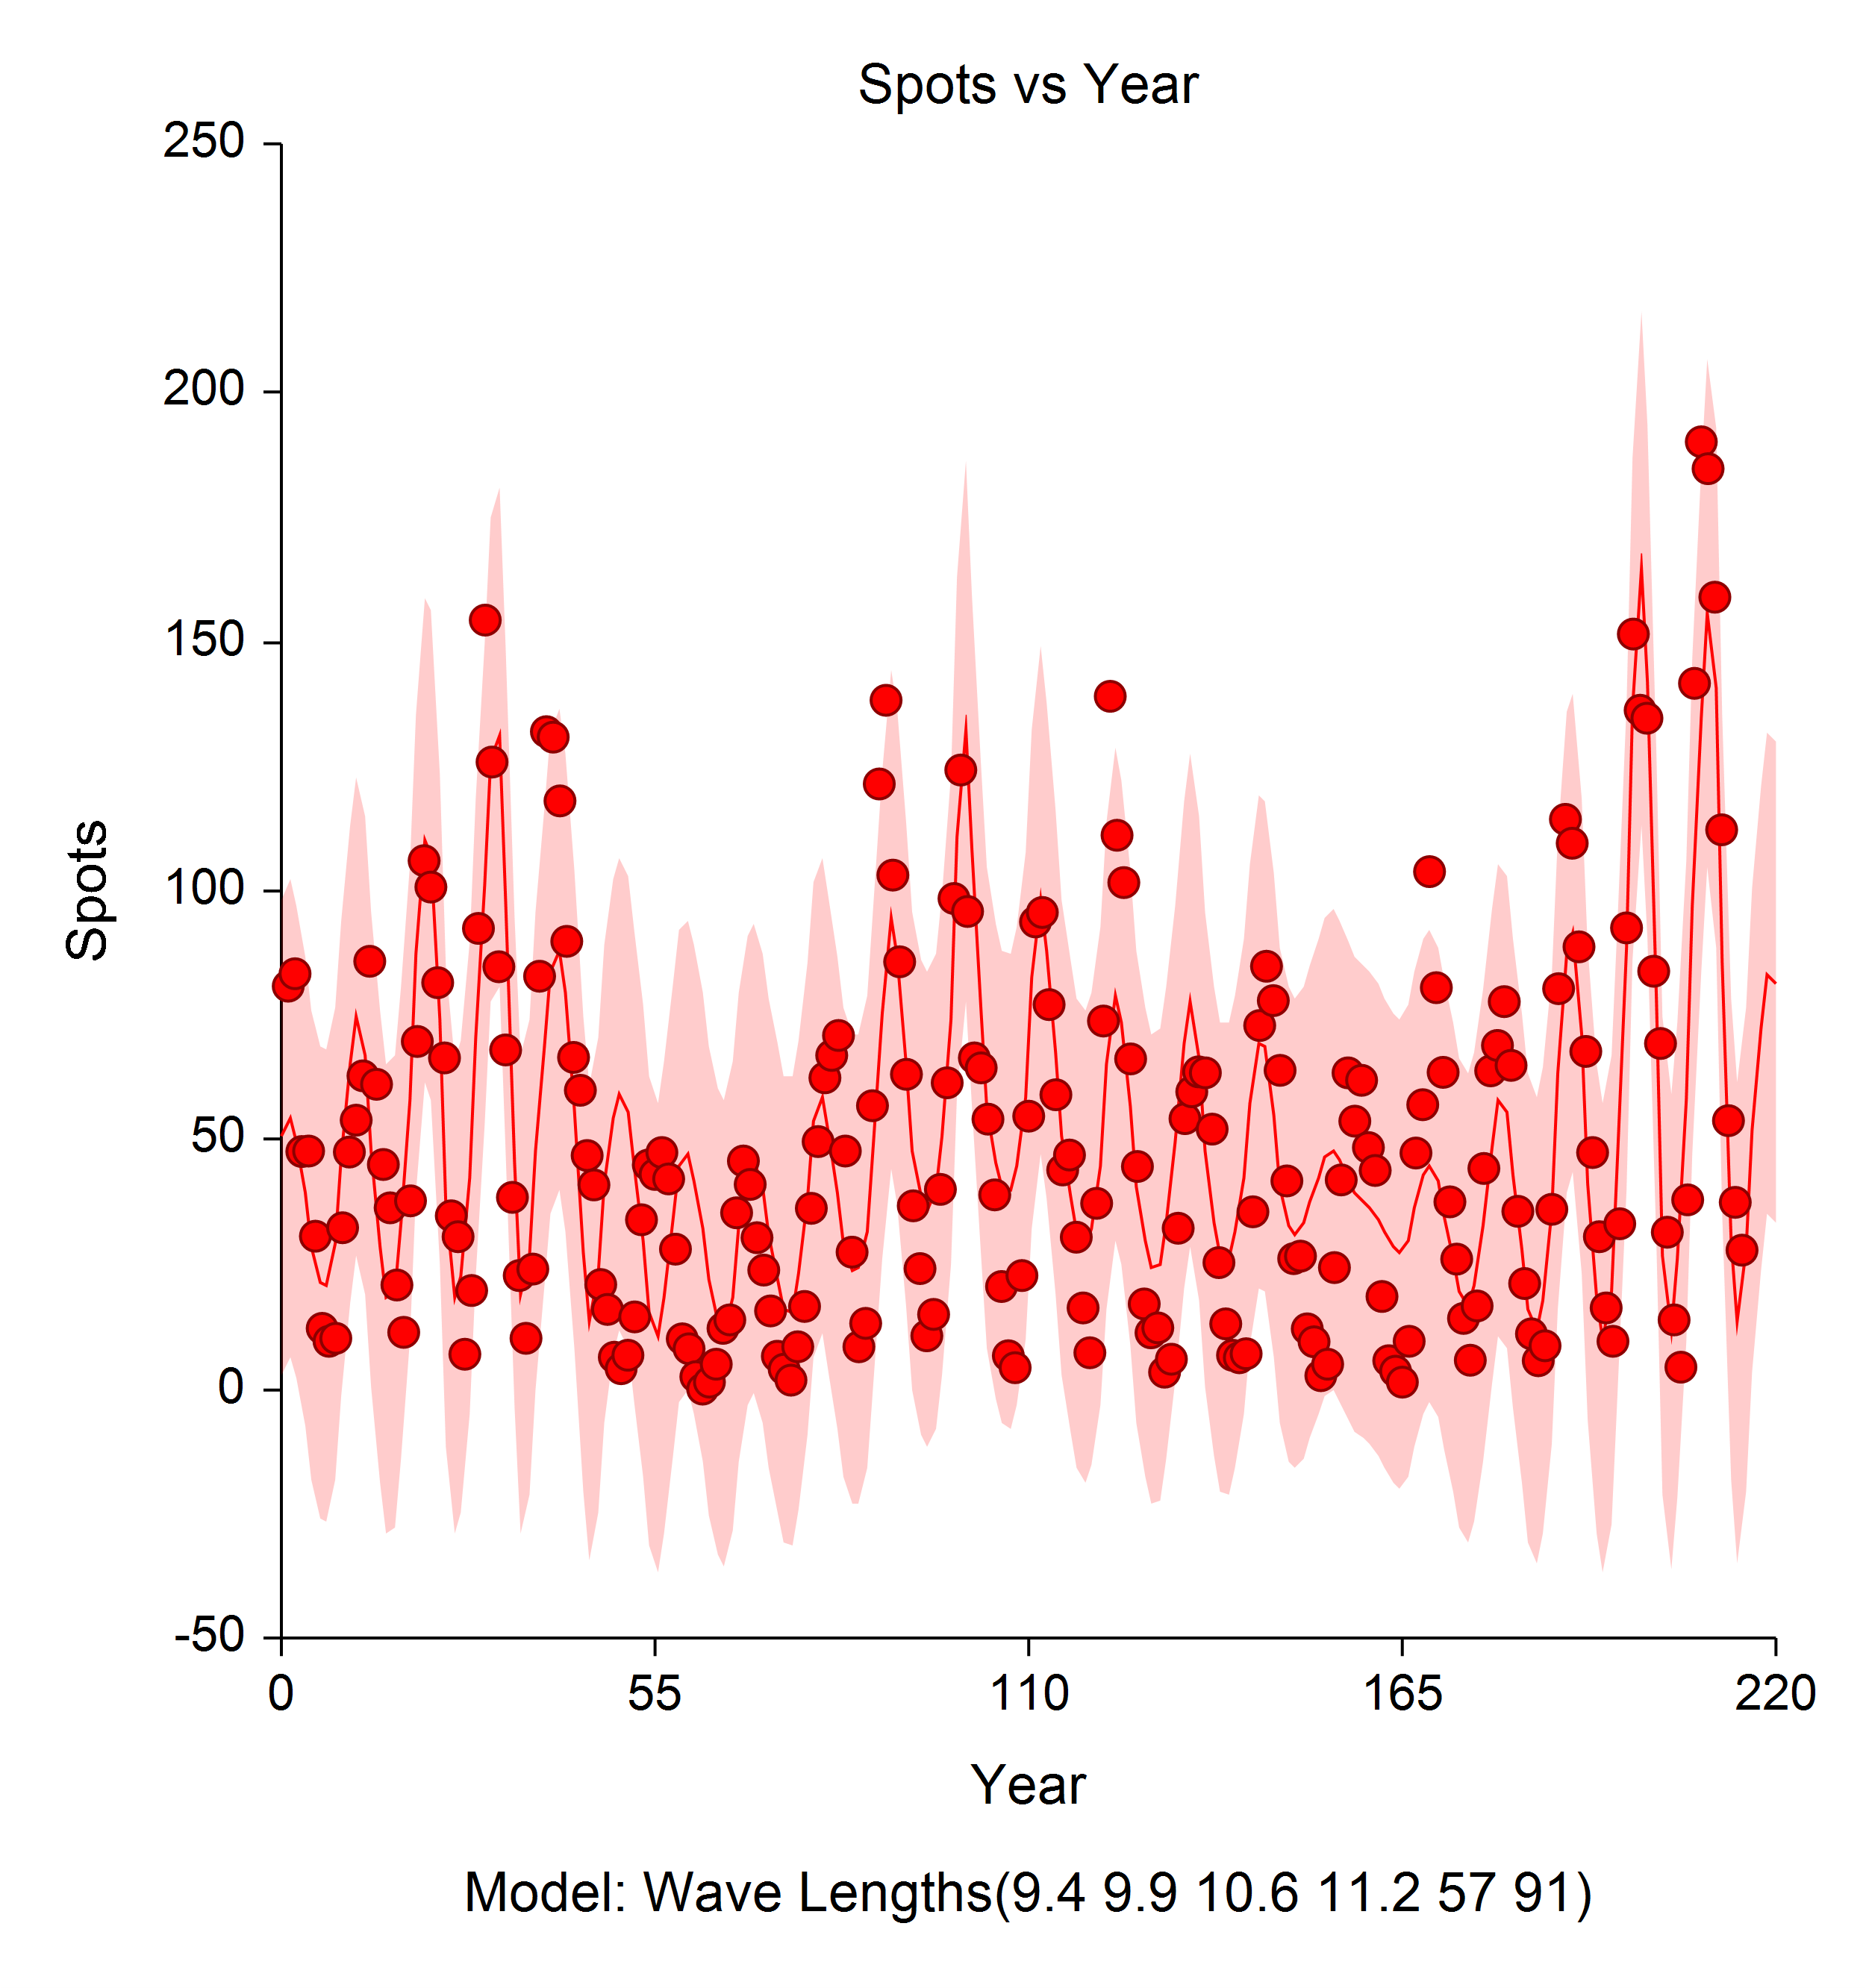
- Harmonic Regression
- 3D Bar Charts
- 3D Bar Charts (2 Factors)
- 3D Line Charts
- 3D Line Charts (2 Factors)
- 3D Scatter Plots (Revised) - Regression Surfaces Added
- Grubbs' Outlier Test
- Paired T-Test for Equivalence
- Paired T-Test for Non-Inferiority
- Testing Non-Inferiority with Two Independent Samples
- Testing Equivalence with Two Independent Samples
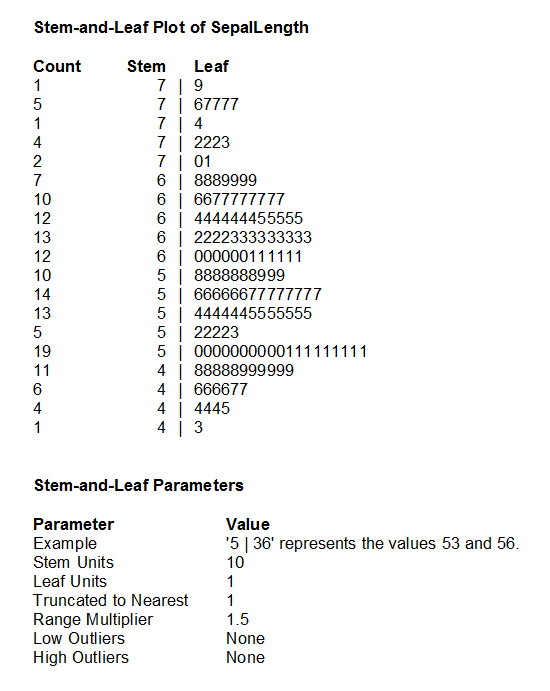
- Stem-and-Leaf Plots
- Back-to-Back Stem-and-Leaf Plots
- X-bar and R Charts
- X-bar and s Charts
- X-bar Charts
- R Charts
- s Charts
- CUSUM Charts
- Moving Average Charts
- EWMA Charts
- Individuals and Moving Range (I-MR) Charts
- P Charts
- NP Charts
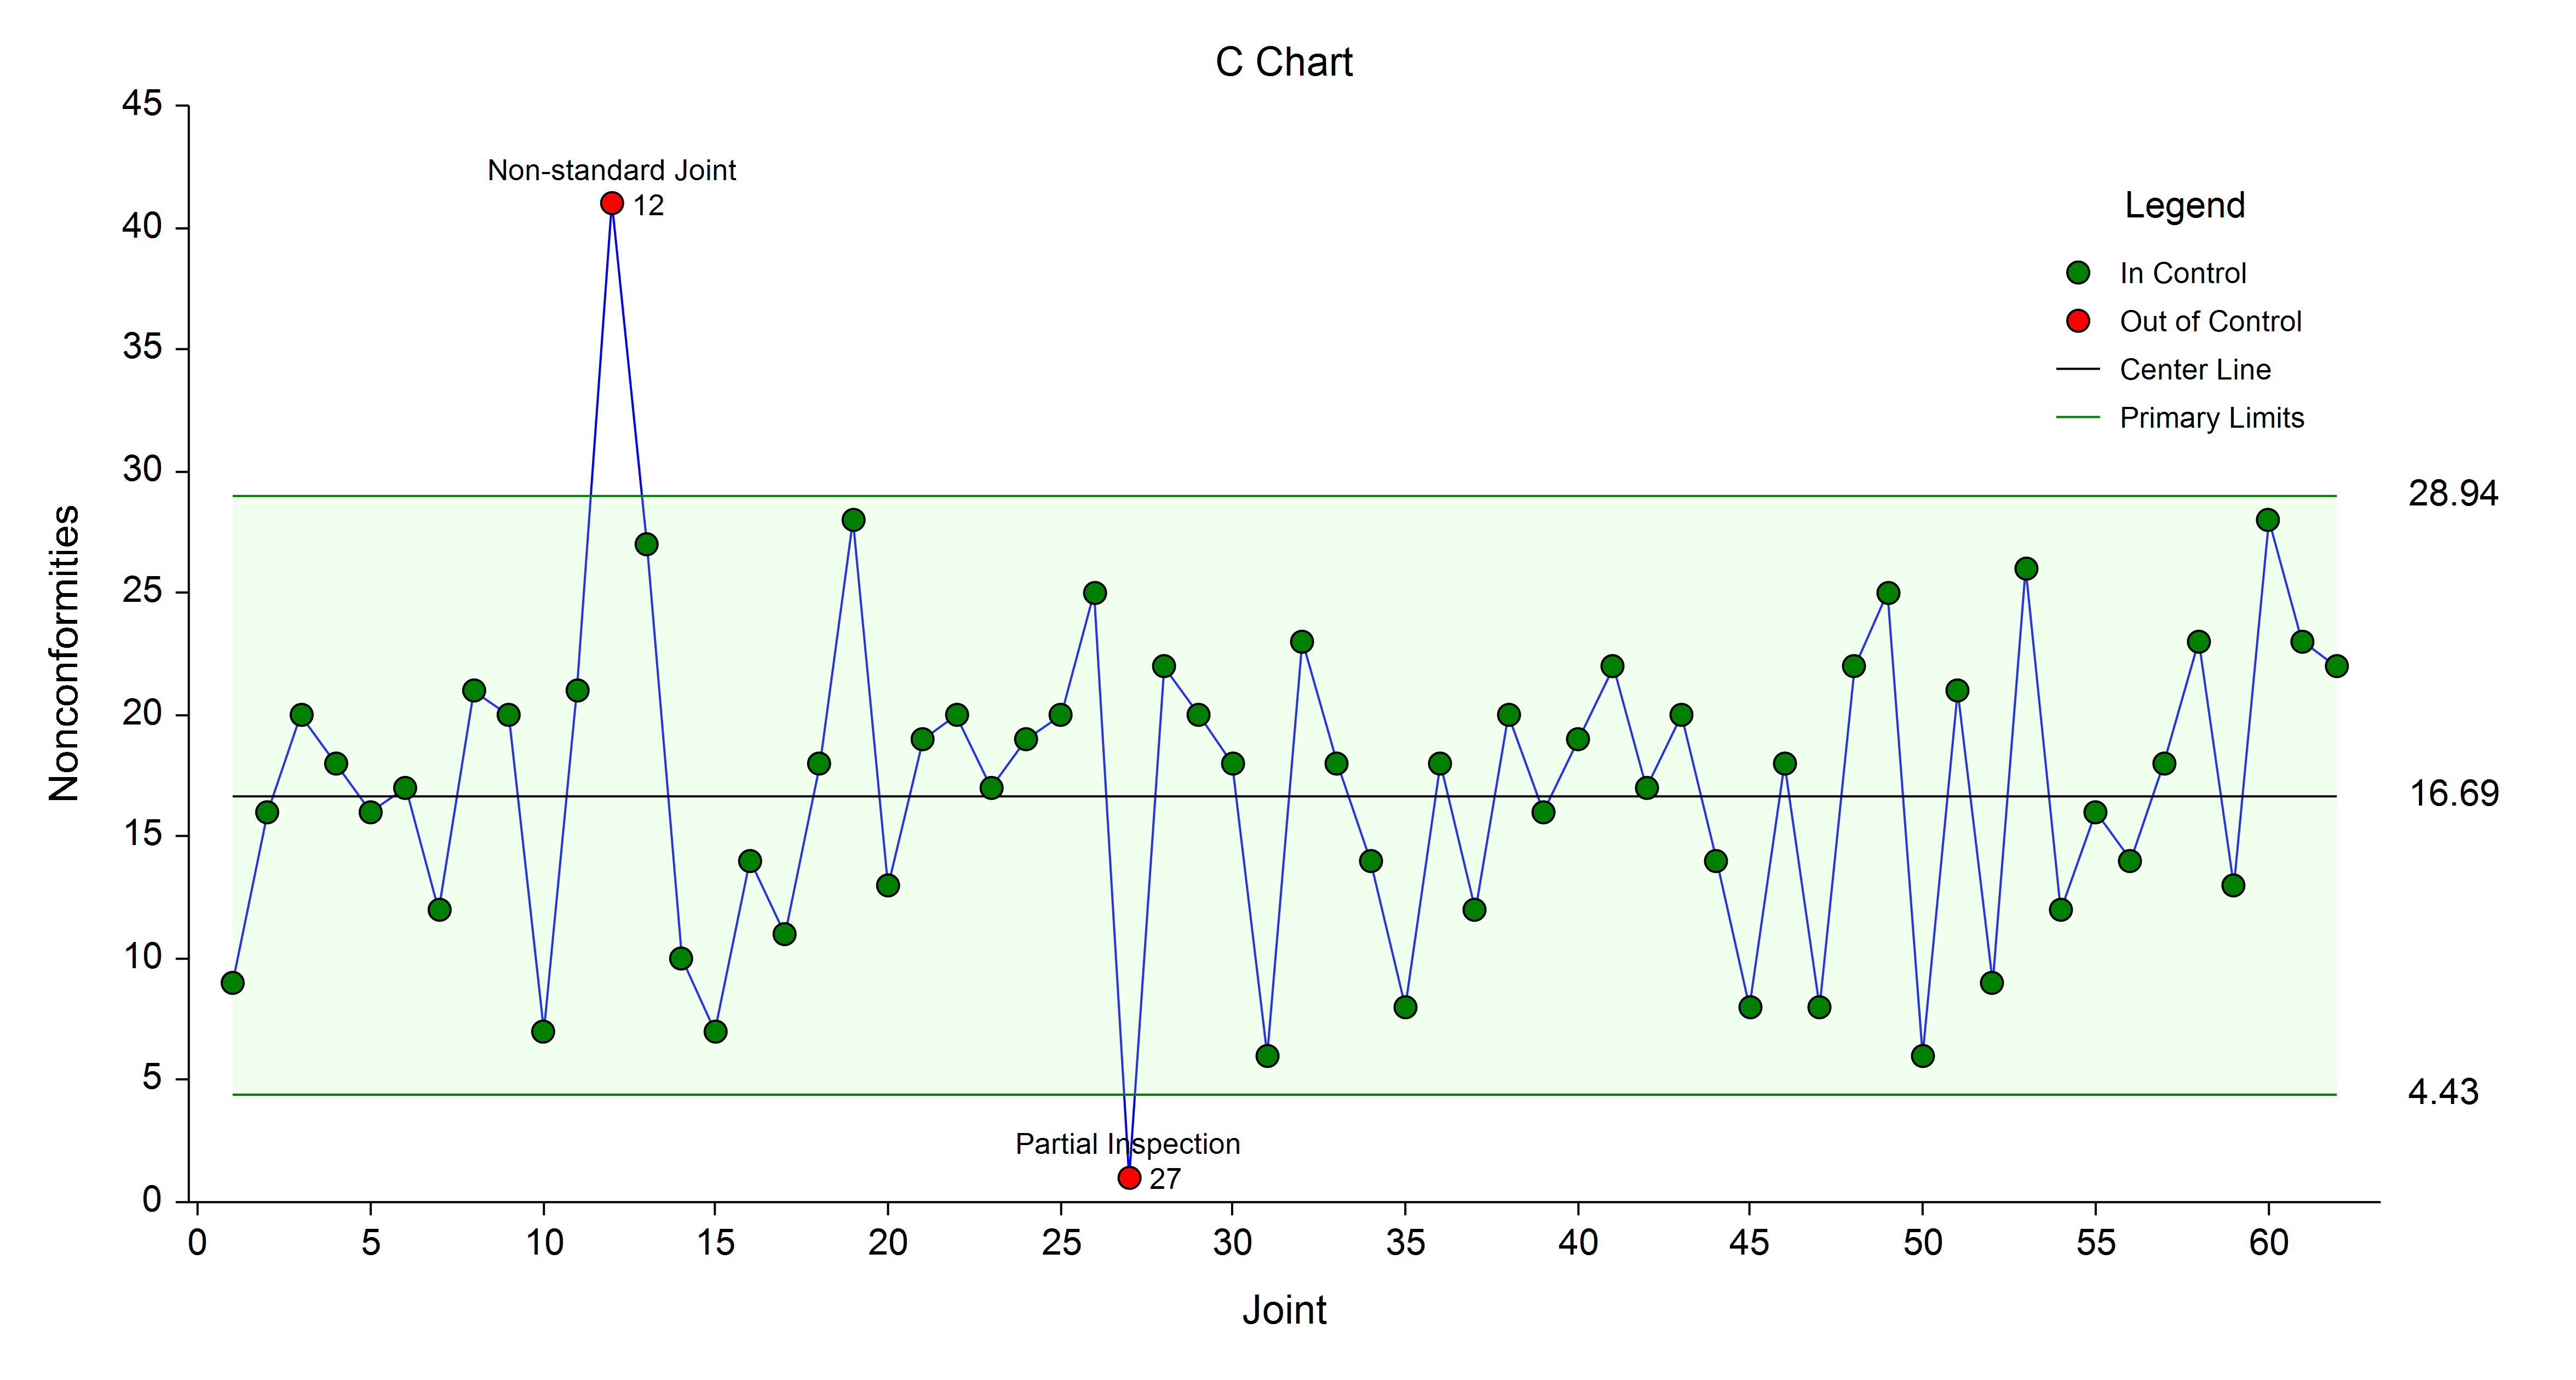
- C Charts
- U Charts
- Capability Analysis
- Normality Tests
- Two Proportions (Revised) - Data Input Enhanced
- Two Proportions - Non-Inferiority Tests
- Two Proportions - Superiority Tests
- Two Proportions - Two-Sided Tests vs. a Margin
- Two Proportions - Equivalence Tests
- Two Correlated Proportions (McNemar Test) (Revised) - Data Input Enhanced
- Two Correlated Proportions - Superiority Tests
- Two Correlated Proportions - Equivalence Tests
- Two Correlated Proportions - Non-Inferiority Tests
- Contingency Tables (Revised) - Data Input Enhanced with New Summary Table Input Option
- Cochran-Armitage Proportion Trend Test (in Contingency Tables)
- Gray's Test for Comparing Groups (in Cumulative Incidence)
- Pepe and Mori's Test for Comparing Groups (in Cumulative Incidence)
- Lag Plots
- Analysis of Runs including Wald-Wolfowitz and Other Runs Tests for Randomness
- Normal Probability Plots
- Weibull Probability Plots
- Uniform Probability Plots
- Exponential Probability Plots
- Gamma Probability Plots
- Chi-Square Probability Plots
- Half-Normal Probability Plots
- Log-Normal Probability Plots
- Probability Plot Comparison
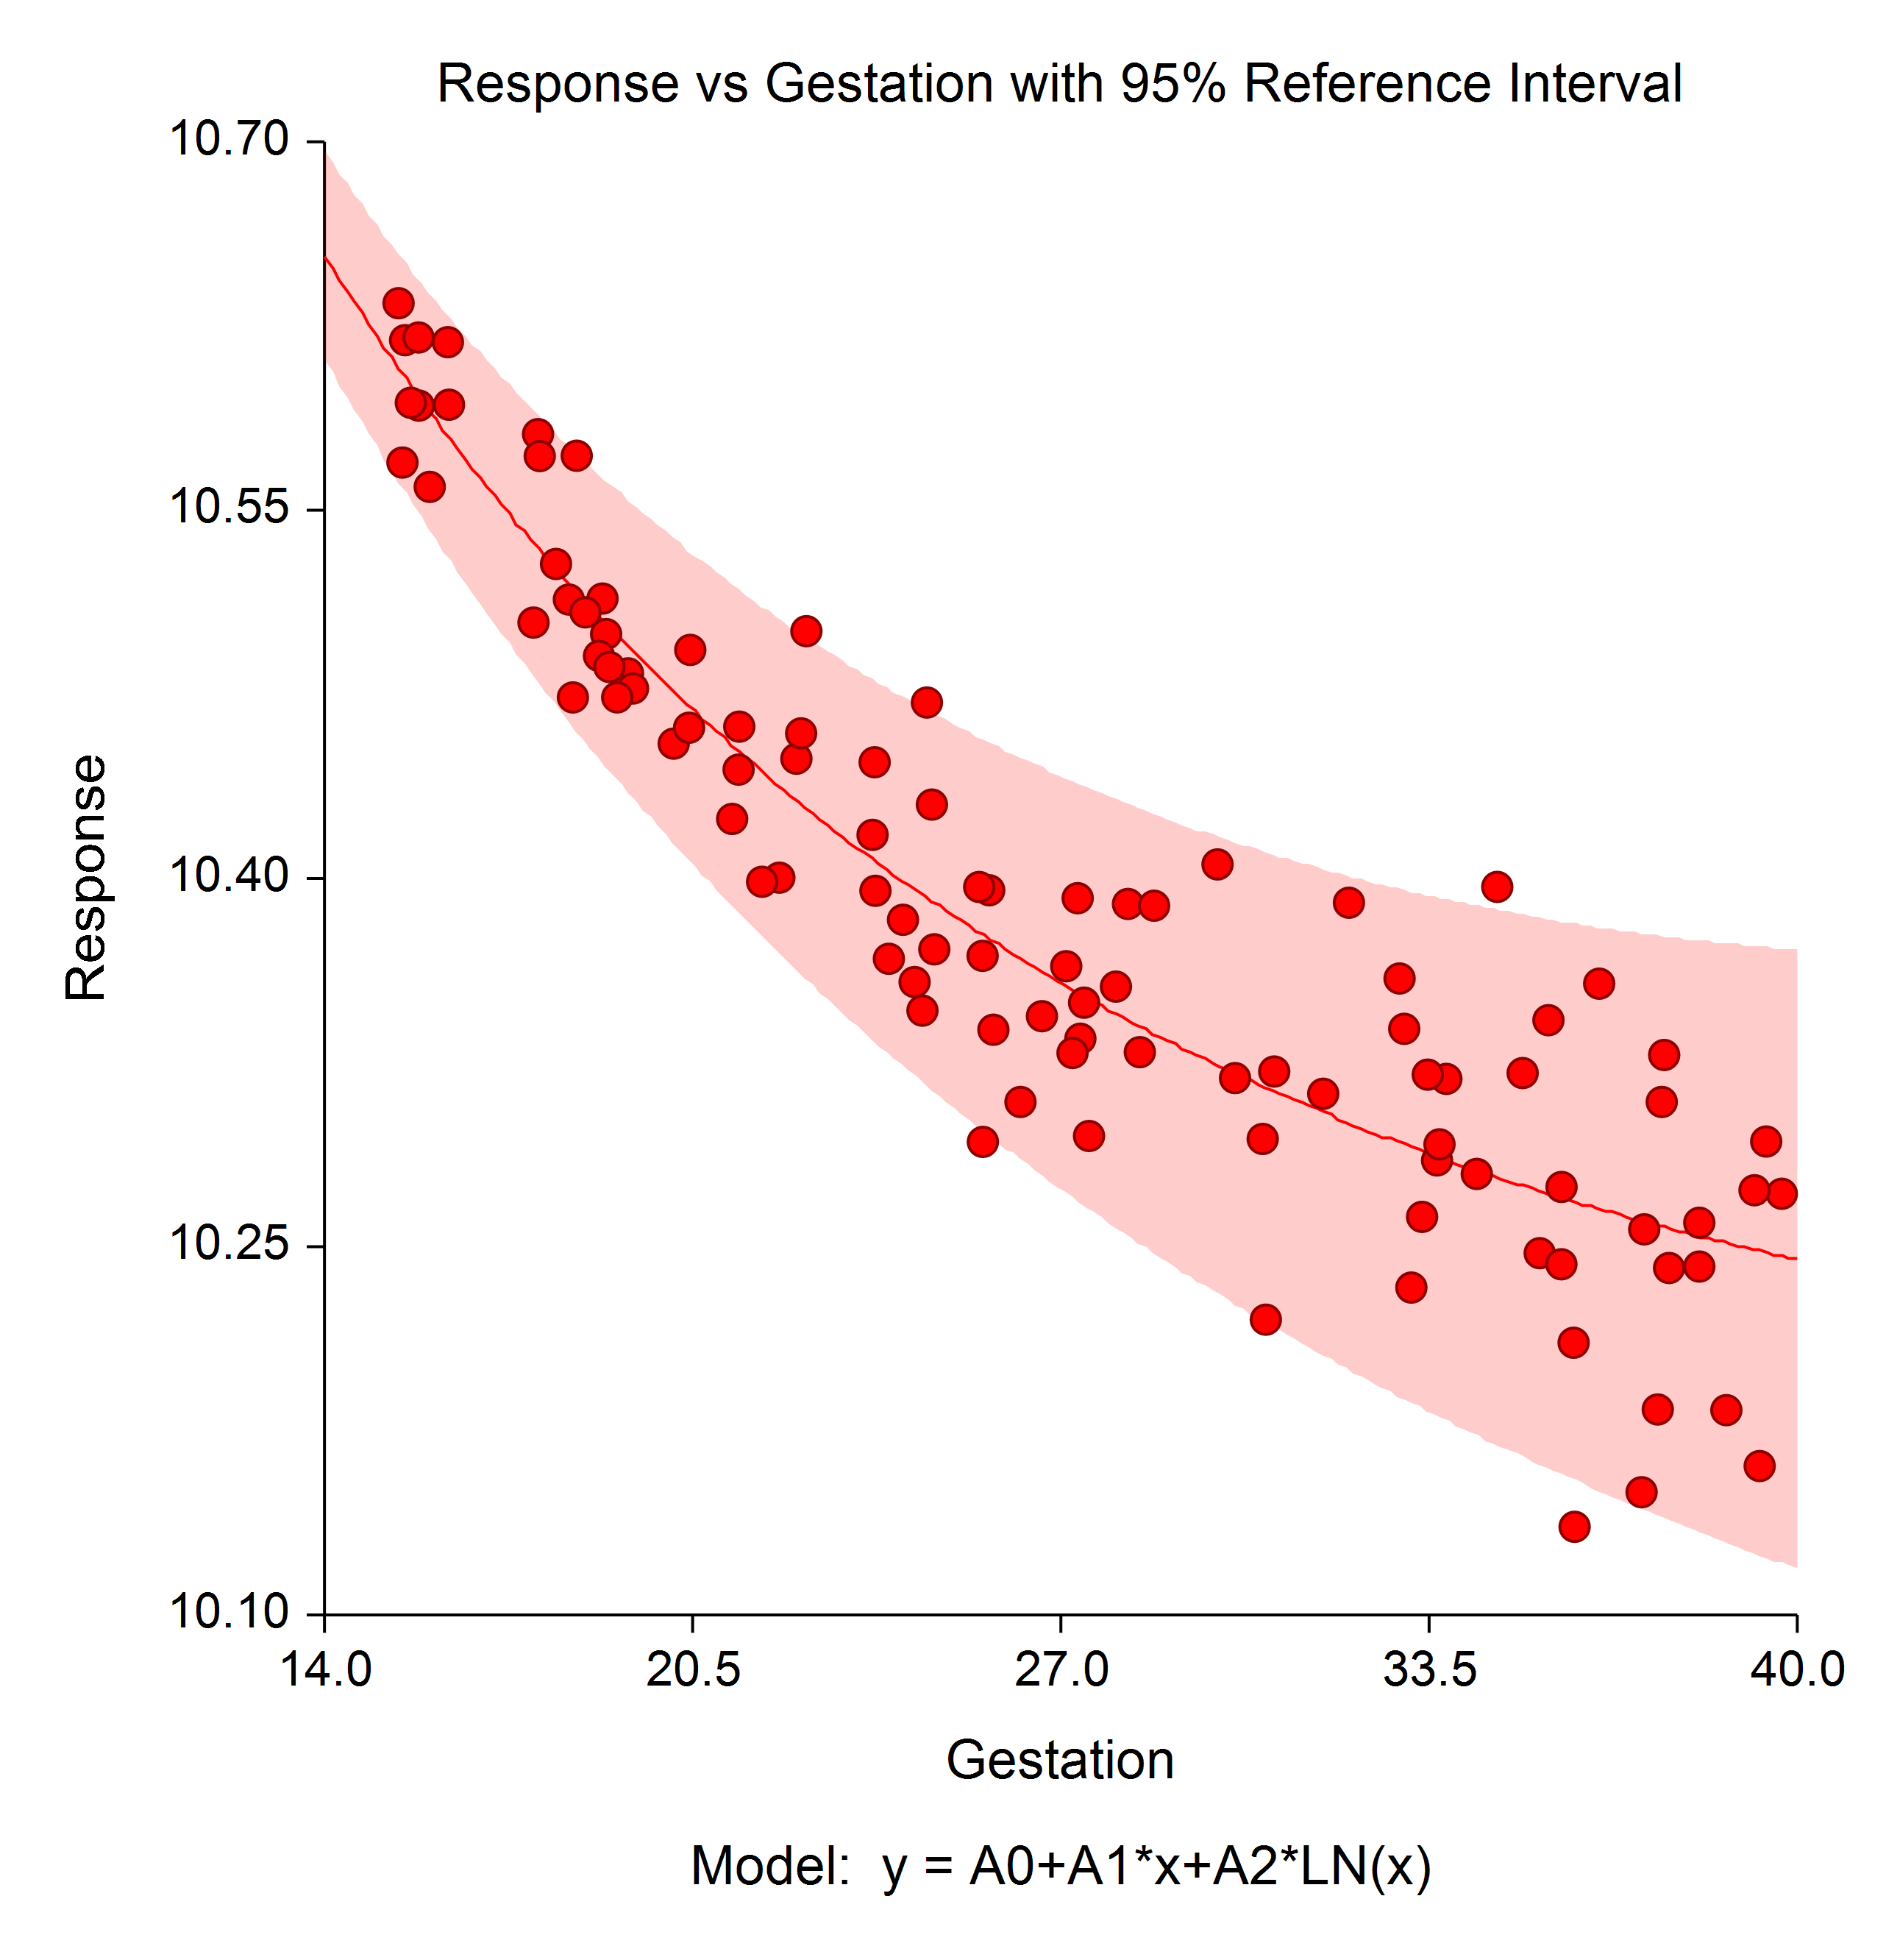
- Reference Intervals with a Covariate
- One-Way ANOVA (Revised) - 3 New Normality Tests
- One-Way ANOVA (Revised) - Welch's Unequal Variance Test
- One-Way ANOVA (Revised) - Sample Group Standard Deviations
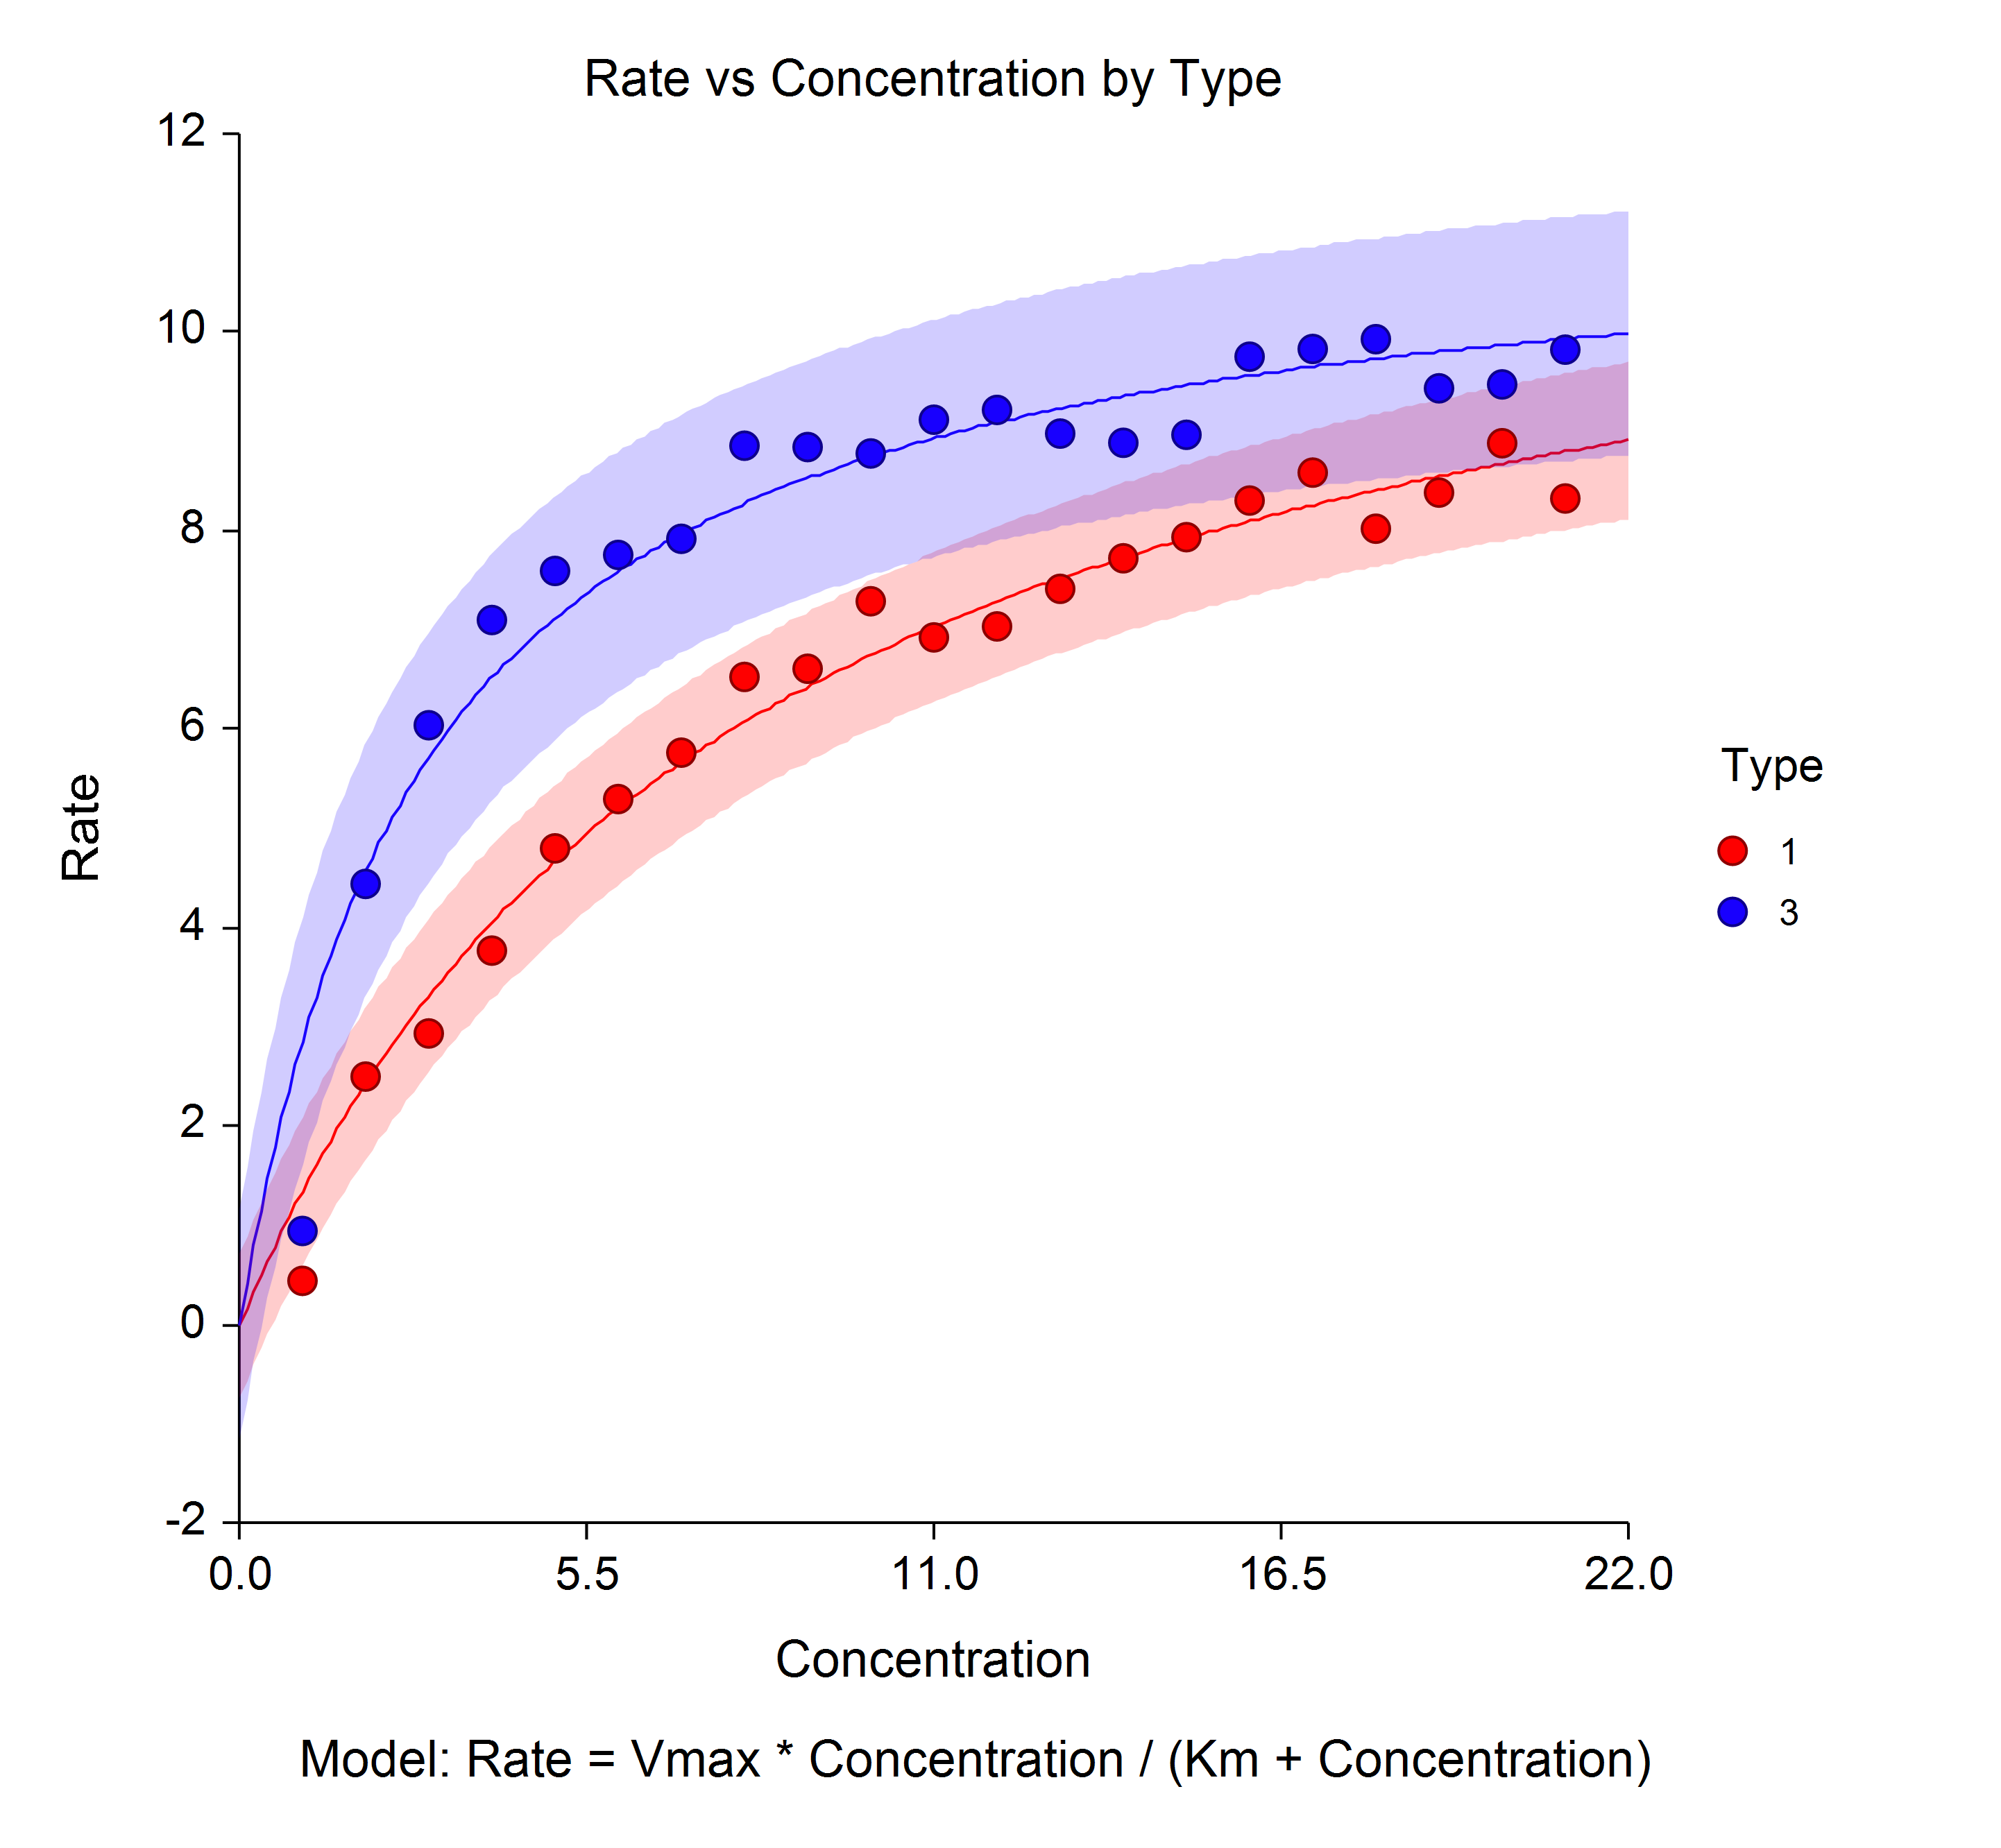
- Michaelis-Menten Equation Plot
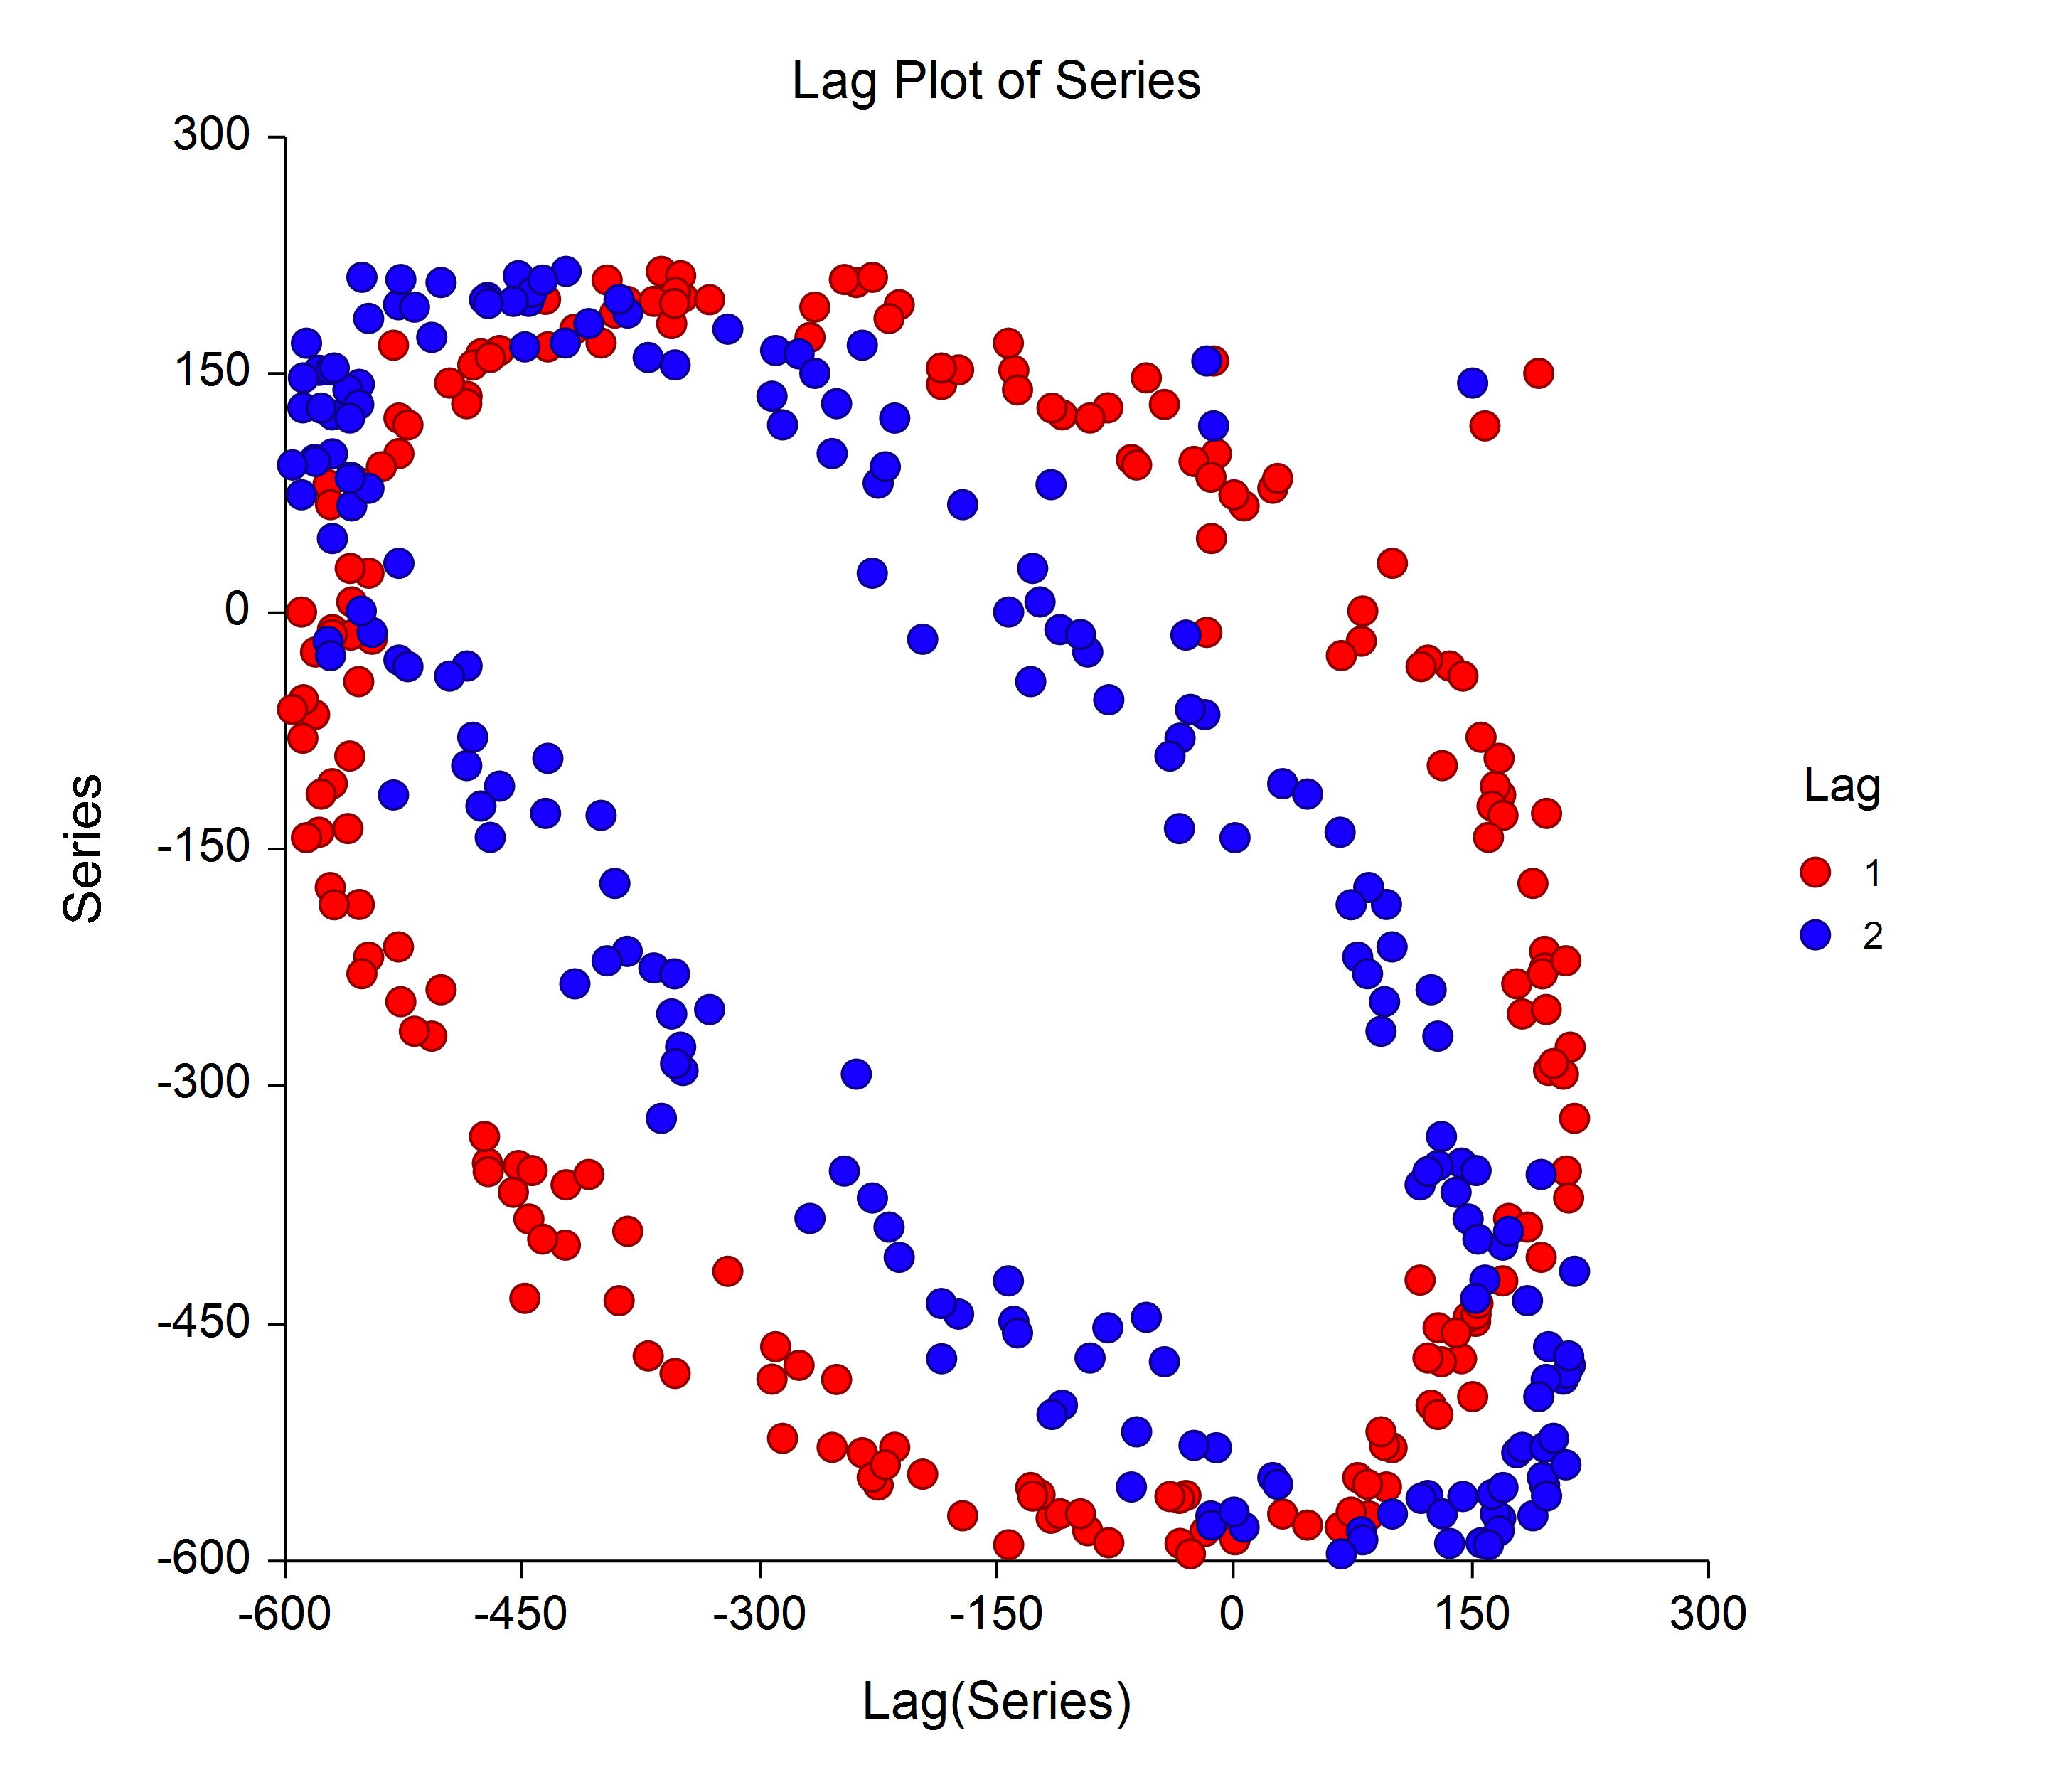
- Lag Plot
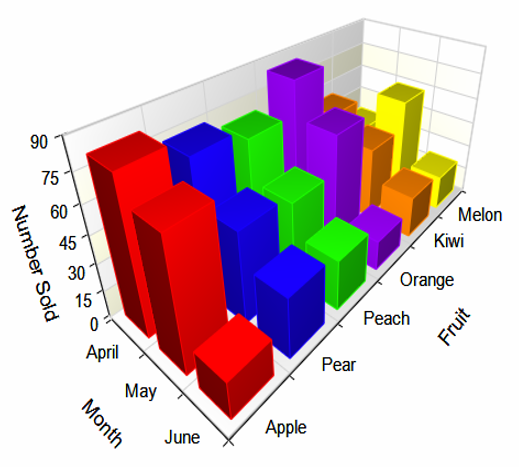
- 3D Bar Charts
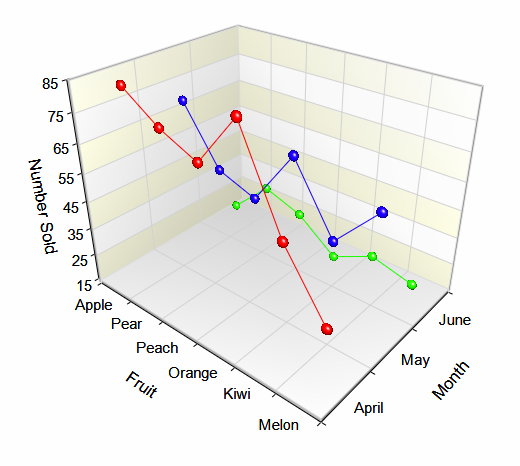
- 3D Line Charts
- Regression Surfaces
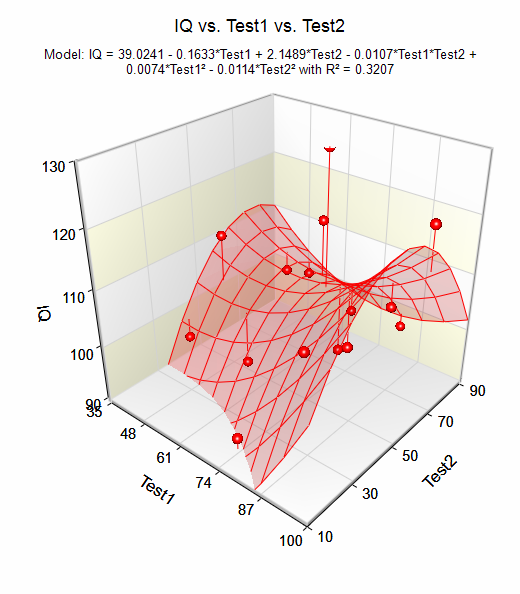
- Box-Cox Transformation Plot
- Quality Control Chart
- Reference Interval Plot
- Stem-and-Leaf Plot
- Model from Harmonic Regression
New Features
64-bit option
With the 32-bit version of NCSS, analysis of datasets with greater than 25 million cells can result in memory errors. The 64-bit version of NCSS 10 increases this limit by many, many times, so that the analysis limits are only those imposed by the amount of memory on the computer. The purchase of NCSS 10 gives you access to both the 32-bit and 64-bit versions.Enhanced Data Stacking and Unstacking Tools
NCSS 10 includes improved tools for stacking and unstacking data. New options in the stack data tool allow you to automatically rename output columns and include label columns in the stacking process so that information about each observation is maintained in the stacked data. The new data unstacking tool also allows you to include label variables and automatically renames output columns. It also allows you to unstack data using a grouping column, which provides greater flexibility in data processing.New Contrast Variable Tool
NCSS 10 includes an all-new data tool to help you create a set of contrasts or binary indicator variables from categorical data columns. These new variables are stored right on the data table.New Transformations
NCSS 10 includes new date-variable processing transformations that allow you to work directly with Date-Time values without having to first translate them to Julian dates before extracting Month, Day, Year, etc. from the date values. NCSS 10 also includes a new transformation to convert Julian dates to Date-Time values and Date-Time values to Julian dates.Copy with Filter
NCSS 10 includes a new data copy function that only copies values from rows that pass the filter.Features and Procedures added in the NCSS 9 Upgrade from NCSS 8
A major focus in the upgrade from NCSS 8 to NCSS 9 was the improved interface and output for many of the commonly used procedures. Several useful new procedures were also added.Procedure Enhancements
Enhancements to:- Multiple Regression
- Cox Regression
- Logistic Regression
- Poisson Regression
- Two-Sample T-Tests (Comparing Two Means or Distributions)
- One-Sample T-Tests (One Sample Inference)
- Paired T-Tests (Paired Sample Inference)
- Two Proportions and 2-by-2 Tables
- One Proportion
- Correlated Proportions and McNemar Test
- Two-Sample T-Tests from Means and Standard Deviations
- Mixed Models
- Contingency (Chi-Square, Two-Way) Tables
- Descriptive Tables
- Frequency Tables
- ANOVA (Tukey-Kramer multiple comparison p-values added)
New Procedures
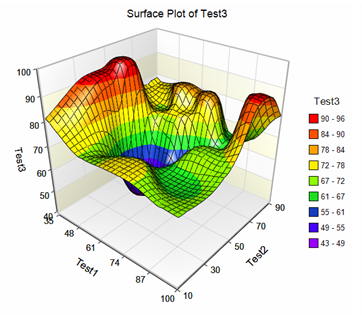
Addition of new plots:- 3D Surface Plots
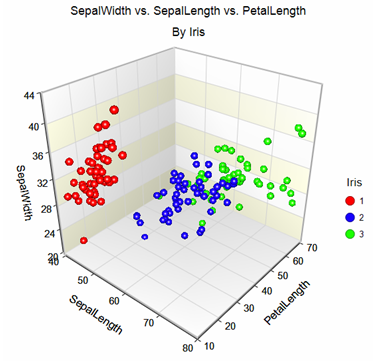
- 3D Scatter Plots
- Mosaic Plots
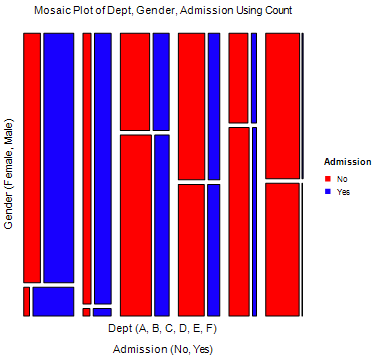 Addition of new procedures:
- Lin's Concordance Correlation Coefficient
- Mixed Models - Repeated Measures
- Mixed Models - No Repeated Measures
- Mixed Models - Random Coefficients
- Subset Selection in Multiple Regression
- Robust Regression
