Description:
In this tutorial we’ll explain what filters are and how to create and use them effectively in NCSS.
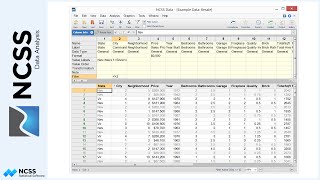
Filters allow you to restrict analyses or graphs to a subset of the data. To illustrate this, we’ll use a dataset with columns that contain the age and gender of participants in a study. Suppose we want to create a scatterplot of the data. Without a filter, all records would be included in the plot. A filter would allow us restrict the data so that only participants of a certain gender and age are included in the plot, without deleting the other records from the dataset.
Let’s begin by creating a scatterplot of Heart Rate vs Age without a filter so we can see what the plot looks like with all the data included. Data labels have been added so we can see what each data point represents. We’ll add this plot to the Gallery so that we can compare it to a filtered plot later.
To create a filter in NCSS, open the data window and click on the Filter button in the toolbar to load the Filter Editor window. Filters are created using three different types of conditional statements: List Conditions, Range Conditions, and Advanced Conditions. We’ll cover all three in this tutorial.
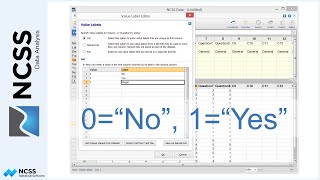
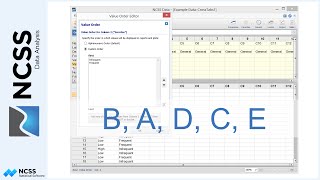
A list condition is one in which you specify a list of values to either include or exclude from analyses or graphs. To create a list condition, click New List Condition and then select a column to filter on. In this example we’ll choose Gender. A list of unique values from the column is presented in the list. Simply check values from the list to create the condition. We’ll select to include only Females. Notice that the filter condition statement is updated automatically as you select values. Use the radio buttons above the list to indicate whether the values you have selected will be kept or excluded. Use the Add Values button to add values to the list that are not in the current dataset.
Click OK to apply the filter. Notice that the columns involved in the filter display a filter icon in the column heading and that the rows where gender equals Male are grayed out because they are excluded by the filter. Change the Hide Filtered Rows option to hide and display filtered rows. Toggle Filter Active to deactivate and reactivate the filter. The filter button on the bottom bar indicates that a filter is active and states the filter being used. Let’s click the button to add another condition to the filter.
A range condition allows us to select records within a certain age range. To add a range condition, click New Range Condition and select the column to filter on. In this example we’ll choose Age. The condition can be fully specified using one or two range statements. Use the dropdowns, input boxes, and radio buttons to specify the range. For the range bounds, you can enter a single value, another column, or a function. We’ll include only participants whose age is greater than or equal to 30 and less than or equal to 60.
Now that we have two filter conditions, we must pay special attention to how the conditions are combined to create the filter. If we select the first combine option, then ALL conditions must be true in order for a row to pass the filter. This is the most restrictive option. In our example this restricts the data so that only females between 30 and 60 years old are included. If we go back and select the second combine option, then records will be included if ANY of the conditions is true. This is less restrictive and excludes fewer rows. In our case, this changes the result so that all females and any males that are in the 30-to-60-year-old age category are included. We’ll go back and use the first combine option for this example.
We can easily edit the filter conditions without returning to the filter editor window. To do this, click on the Column Info tab and edit the conditions right on the table. Notice that the statements in the table do not include column names, just the list or range of values. We’ll change the upper bound on the age range to 50 instead of 60. We can also add new conditions by typing in empty filter cells. Click on the button at the right side of a cell to quickly edit the condition using the editor.
To delete a condition, select the condition from the list and click Delete.
We can save this filter for future use by selecting File then Save Filter to a File from the menu. NCSS Filter Files are stored with the extension .NCSSFILTER. Since the filter files are stored separately from the dataset, they can be used by any dataset as long as the column names in the filter match the names in the dataset. To load a saved filter, select File then Load a Saved Filter from a File.
With the filter set, let’s now re-create the scatter plot. On the report, the page heading states the filter that was active when the plot was generated. As you can see from the data labels, all points included on the plot satisfy the filter conditions. If we compare this plot to the scatterplot that we generated at the beginning of the tutorial, we can see that a large number of points have been excluded by the filter.
The third type of filter condition is the Advanced Condition, which gives you complete control over your filter. To add an advanced condition, click New Advanced Condition. With this type of condition, you can enter virtually any filter statement you want. The statement can contain lists, ranges, column names, and functions. Combine statements with any combination of AND, OR, and parentheses as needed. We’ll enter a complex filter involving a function with more than one column. Click OK to apply the filter.
Since we have created an advanced filter condition, another item appears on the Column Info table. This statement can be edited right on the data table just like any other condition.